Chart Pattern Library
Master 43 professional technical analysis patterns. Click any card to flip and explore trading strategies.
Showing 43 patterns
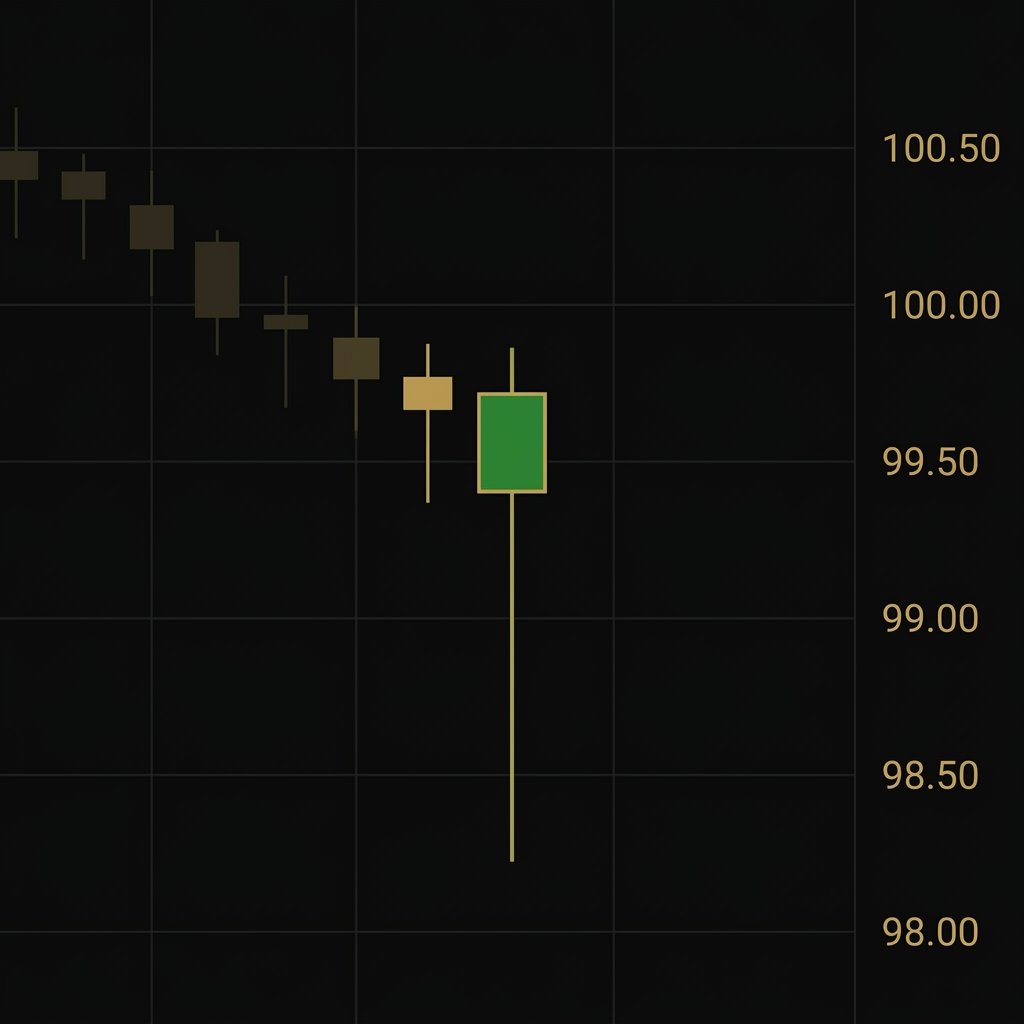
Hammer
A single candlestick pattern with a small body at the top and a long lower shadow (at least 2x the body length). It forms at the bottom of a downtrend, signaling that sellers pushed price significantl...
Hammer
A single candlestick pattern with a small body at the top and a long lower shadow (at least 2x the body length). It forms at the bottom of a downtrend, signaling that sellers pushed price significantl...
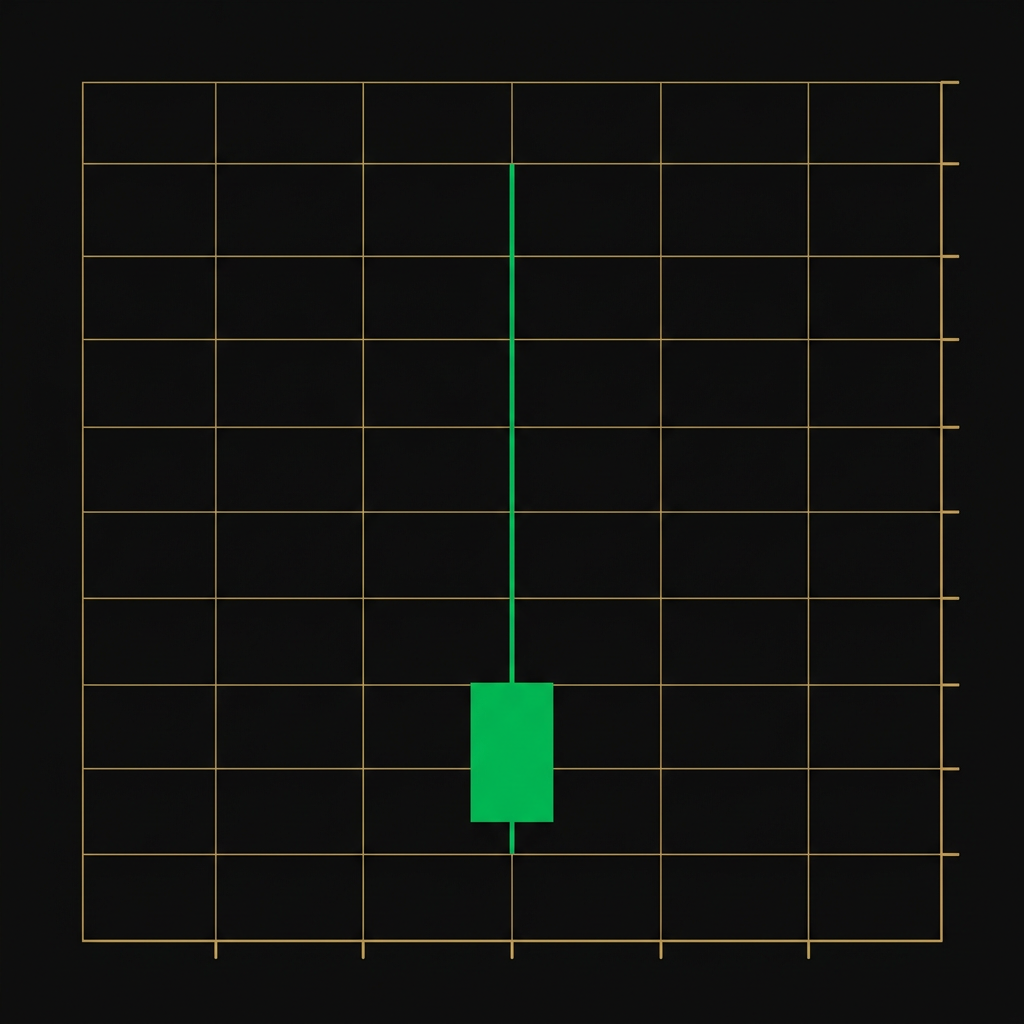
Inverted Hammer
A candlestick with a small body at the bottom and a long upper shadow (at least 2x the body). Found at the bottom of downtrends, it shows buyers attempted to push higher but couldn't sustain the move....
Inverted Hammer
A candlestick with a small body at the bottom and a long upper shadow (at least 2x the body). Found at the bottom of downtrends, it shows buyers attempted to push higher but couldn't sustain the move....
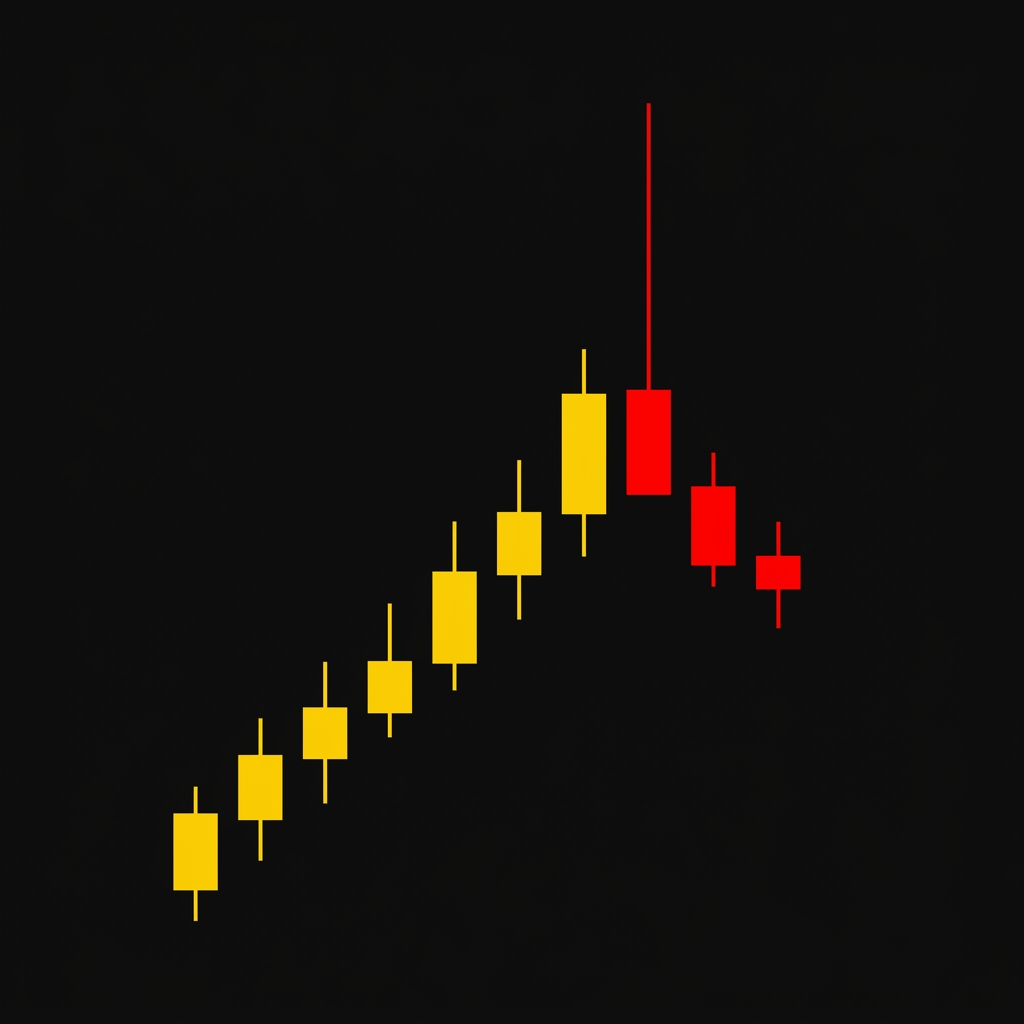
Shooting Star
A bearish reversal candlestick with a small body near the low and a long upper shadow. Appears at the top of an uptrend. Buyers pushed price to new highs but sellers took complete control by the close...
Shooting Star
A bearish reversal candlestick with a small body near the low and a long upper shadow. Appears at the top of an uptrend. Buyers pushed price to new highs but sellers took complete control by the close...

Doji
A candlestick where the open and close are virtually identical, creating a cross or plus-sign shape. The doji represents perfect indecision between buyers and sellers. Its significance depends entirel...
Doji
A candlestick where the open and close are virtually identical, creating a cross or plus-sign shape. The doji represents perfect indecision between buyers and sellers. Its significance depends entirel...
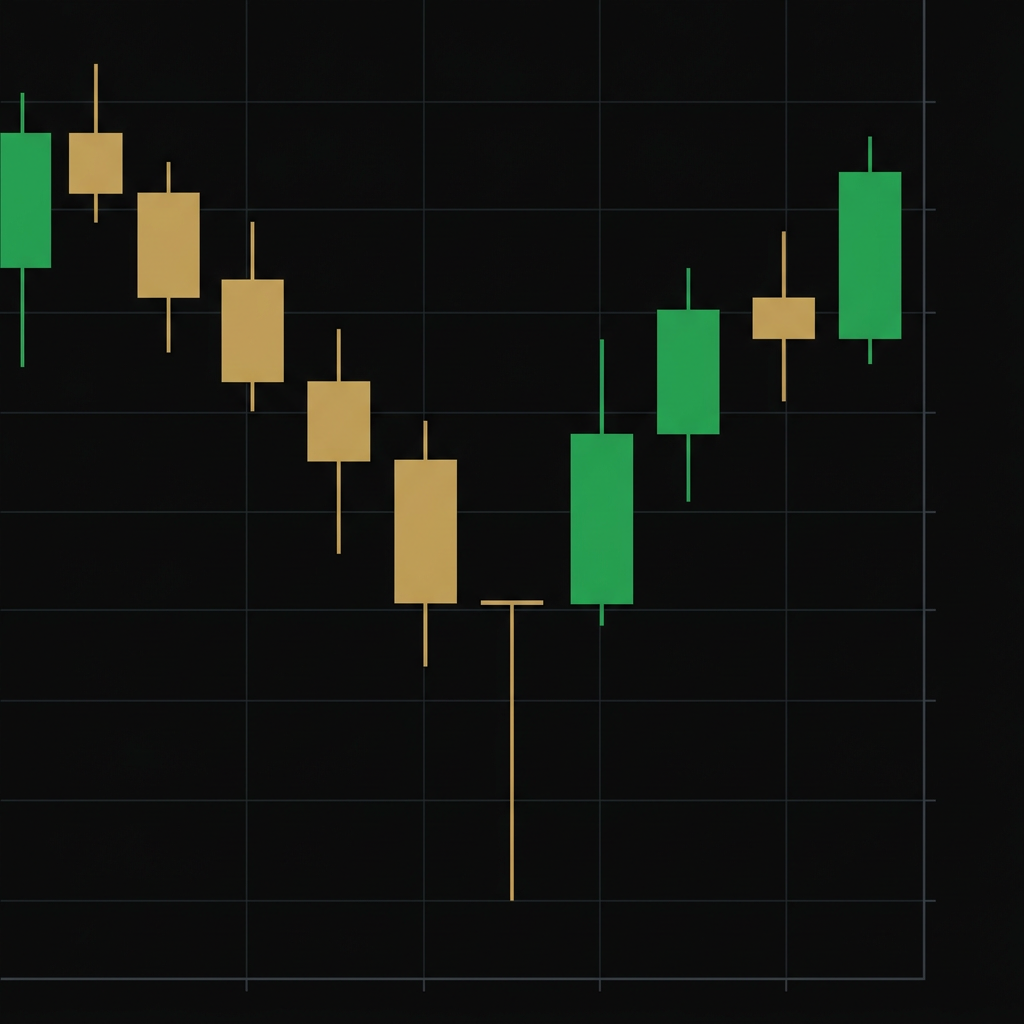
Dragonfly Doji
A doji variant where the open, close, and high are all at the same level, with a long lower shadow. It looks like a T-shape. Found at the bottom of downtrends, it's a powerful bullish reversal signal.
Dragonfly Doji
A doji variant where the open, close, and high are all at the same level, with a long lower shadow. It looks like a T-shape. Found at the bottom of downtrends, it's a powerful bullish reversal signal.
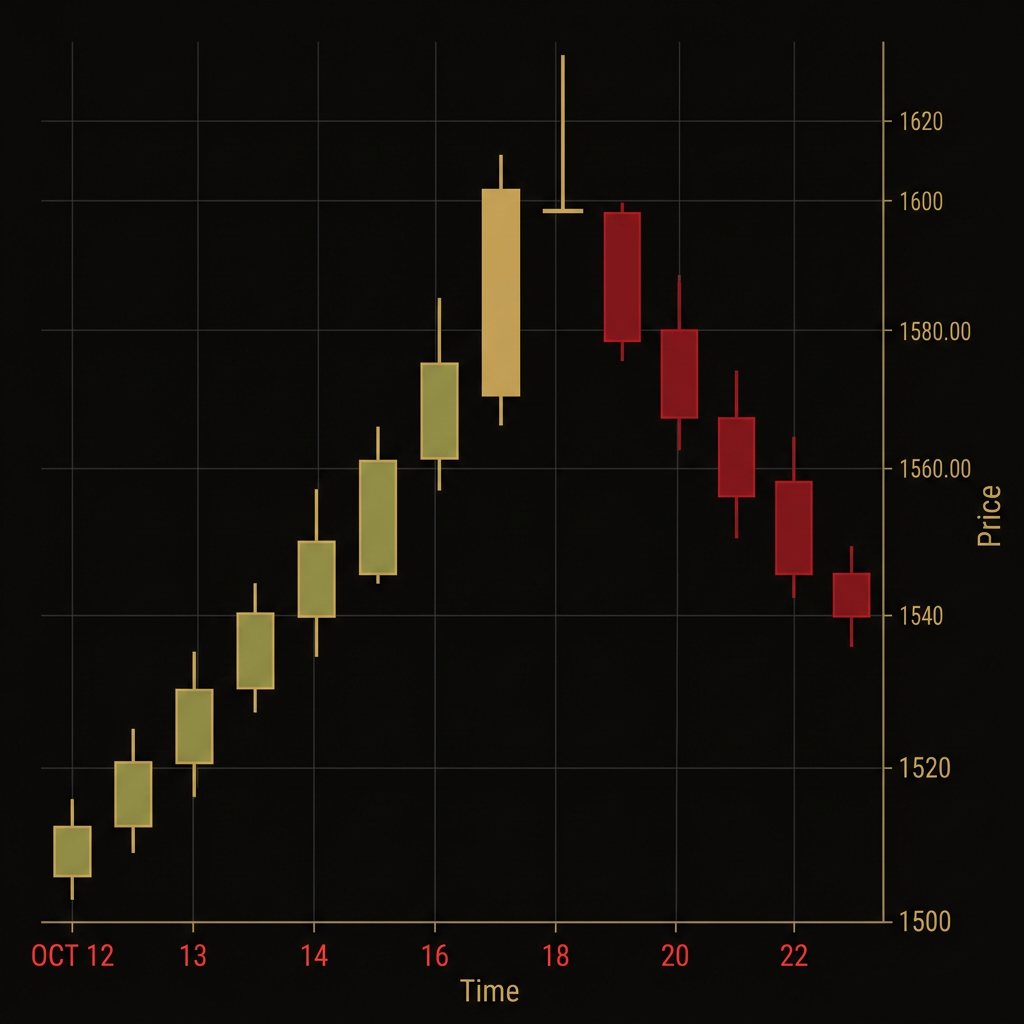
Gravestone Doji
A doji variant where the open, close, and low are at the same level with a long upper shadow. Shaped like an inverted T. Found at the top of uptrends, it signals powerful bearish reversal.
Gravestone Doji
A doji variant where the open, close, and low are at the same level with a long upper shadow. Shaped like an inverted T. Found at the top of uptrends, it signals powerful bearish reversal.
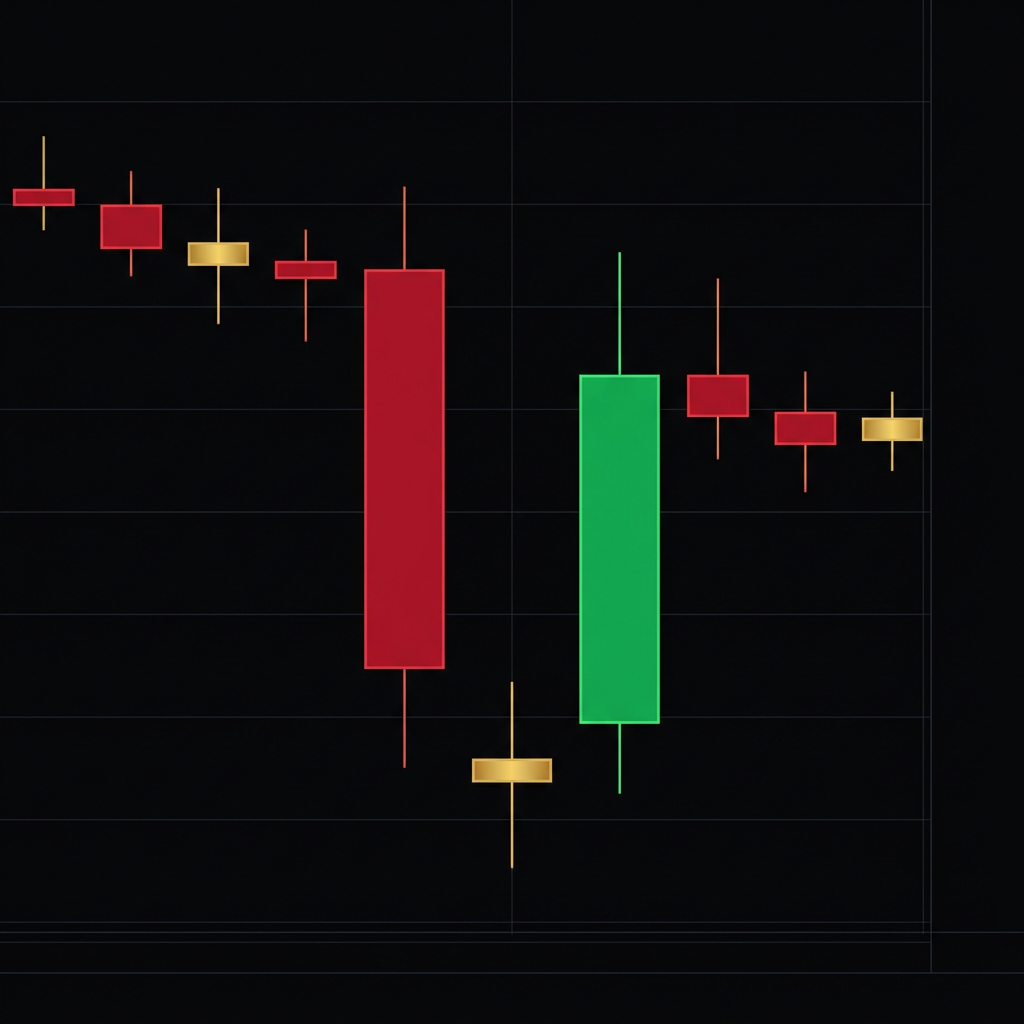
Morning Star
A powerful three-candle bullish reversal pattern: (1) a large bearish candle confirming the downtrend, (2) a small-bodied candle (doji or spinning top) that gaps lower showing indecision, (3) a large ...
Morning Star
A powerful three-candle bullish reversal pattern: (1) a large bearish candle confirming the downtrend, (2) a small-bodied candle (doji or spinning top) that gaps lower showing indecision, (3) a large ...
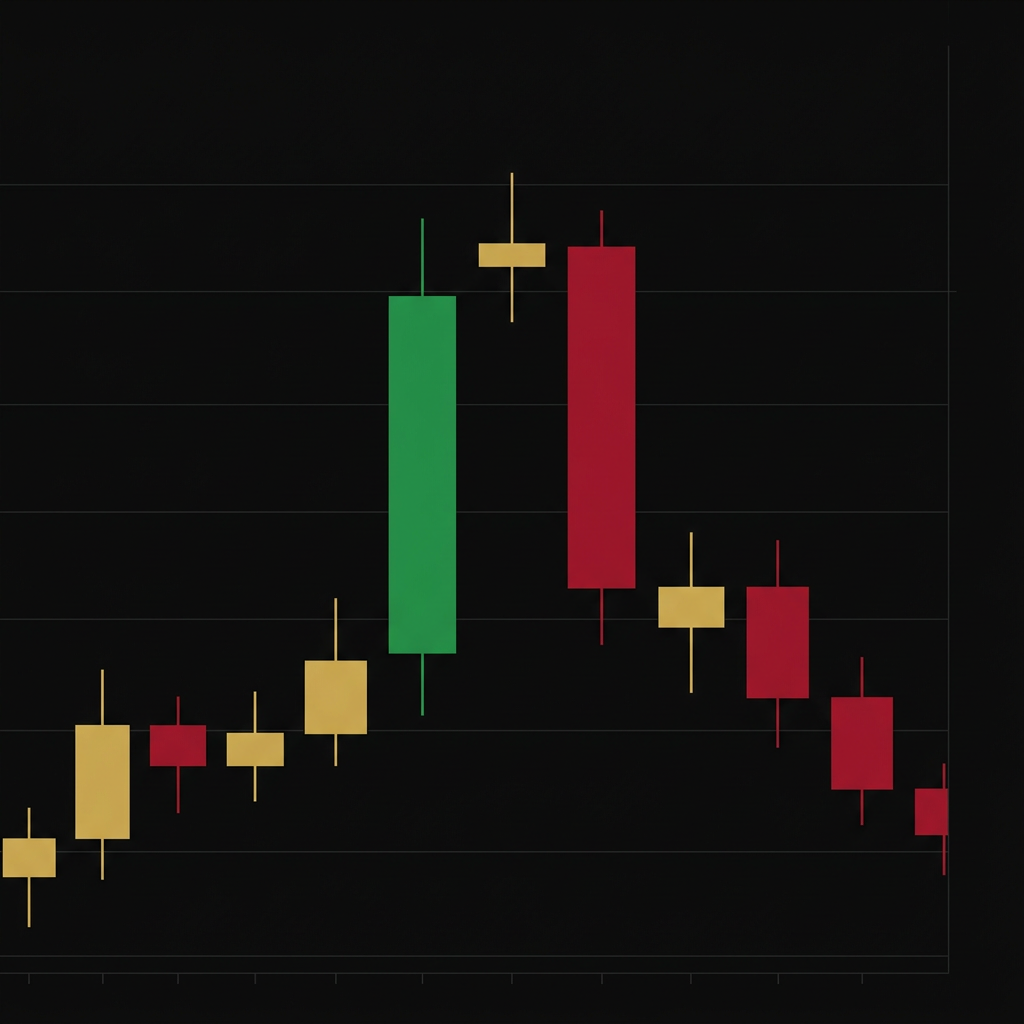
Evening Star
The bearish counterpart of the morning star. A three-candle pattern: (1) large bullish candle, (2) small indecision candle gapping higher, (3) large bearish candle closing well into the first candle's...
Evening Star
The bearish counterpart of the morning star. A three-candle pattern: (1) large bullish candle, (2) small indecision candle gapping higher, (3) large bearish candle closing well into the first candle's...
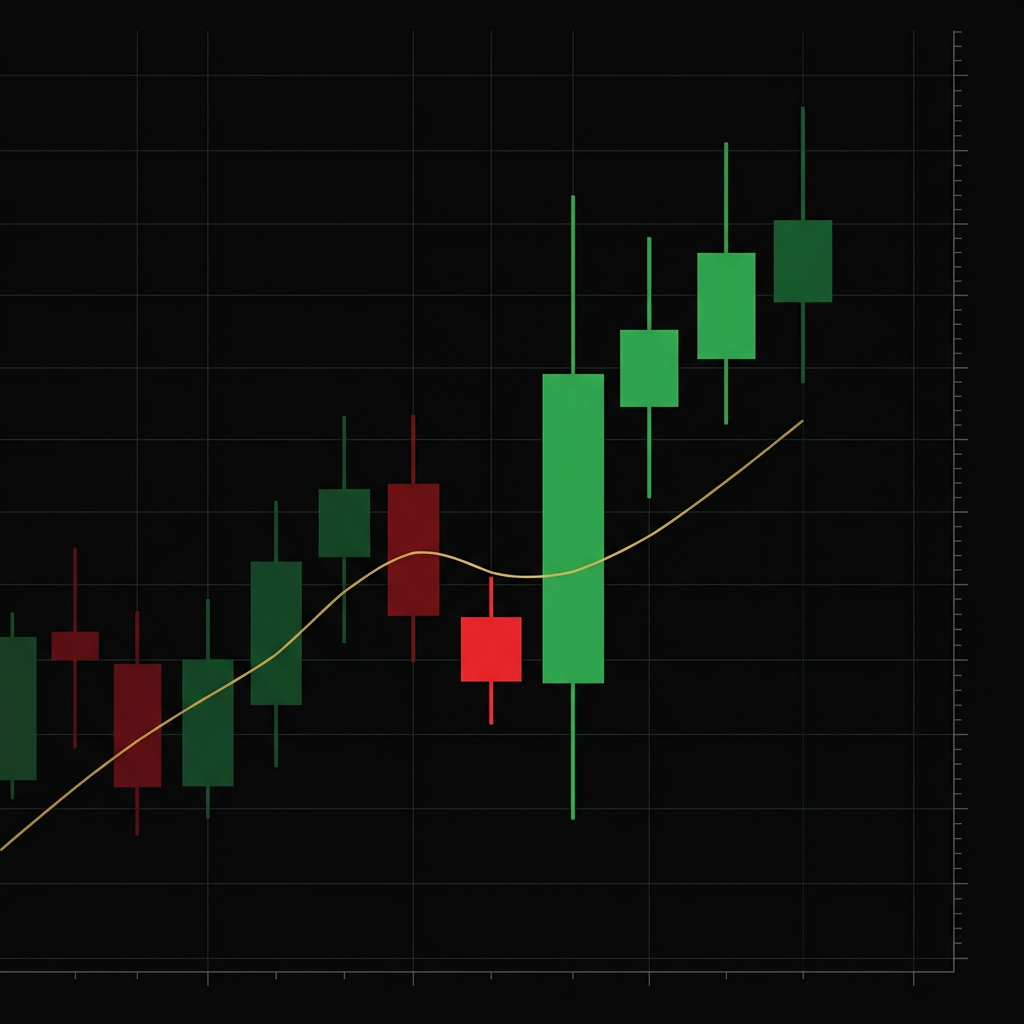
Bullish Engulfing
A two-candle pattern where a small bearish candle is completely 'engulfed' by a larger bullish candle that follows. The bullish candle's body fully covers the prior bearish body. One of the most relia...
Bullish Engulfing
A two-candle pattern where a small bearish candle is completely 'engulfed' by a larger bullish candle that follows. The bullish candle's body fully covers the prior bearish body. One of the most relia...
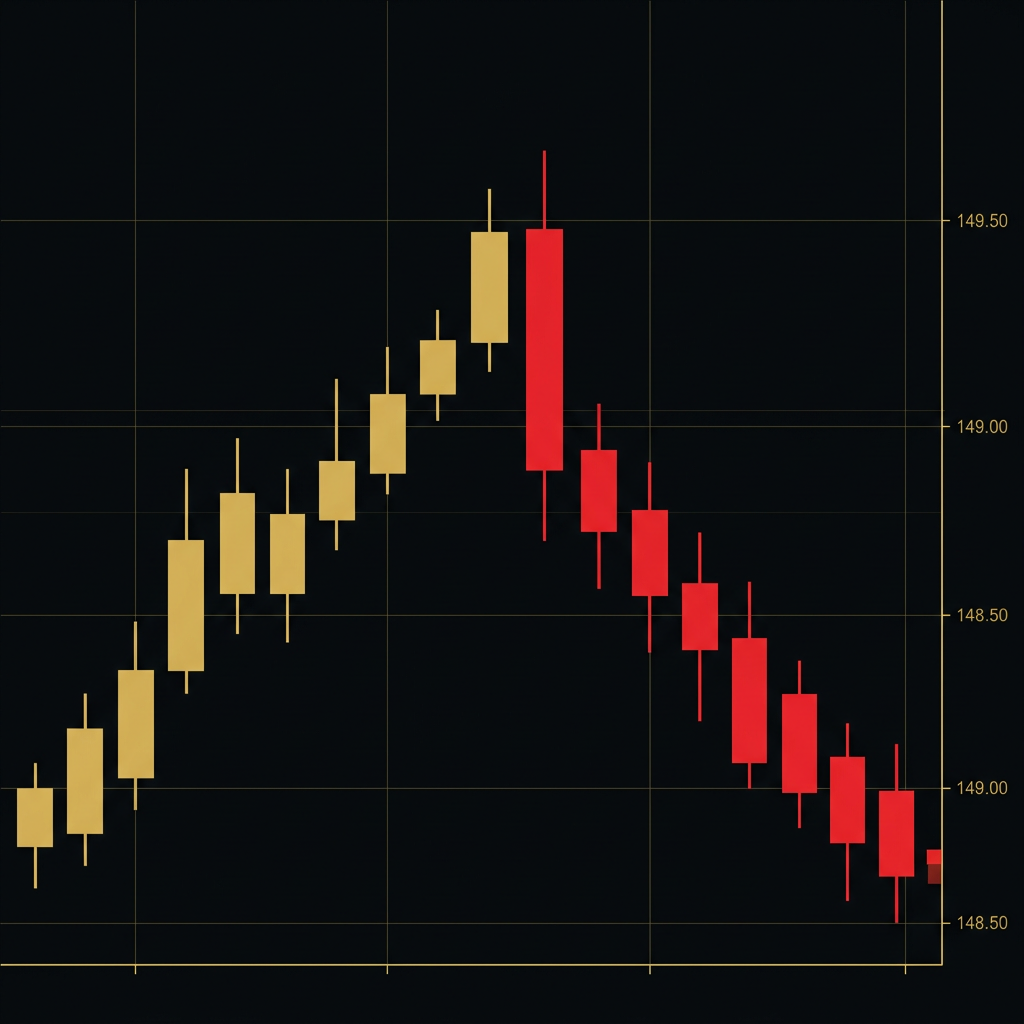
Bearish Engulfing
A small bullish candle followed by a larger bearish candle that completely engulfs the prior body. Found at the top of uptrends, it signals aggressive selling has overwhelmed the buyers.
Bearish Engulfing
A small bullish candle followed by a larger bearish candle that completely engulfs the prior body. Found at the top of uptrends, it signals aggressive selling has overwhelmed the buyers.
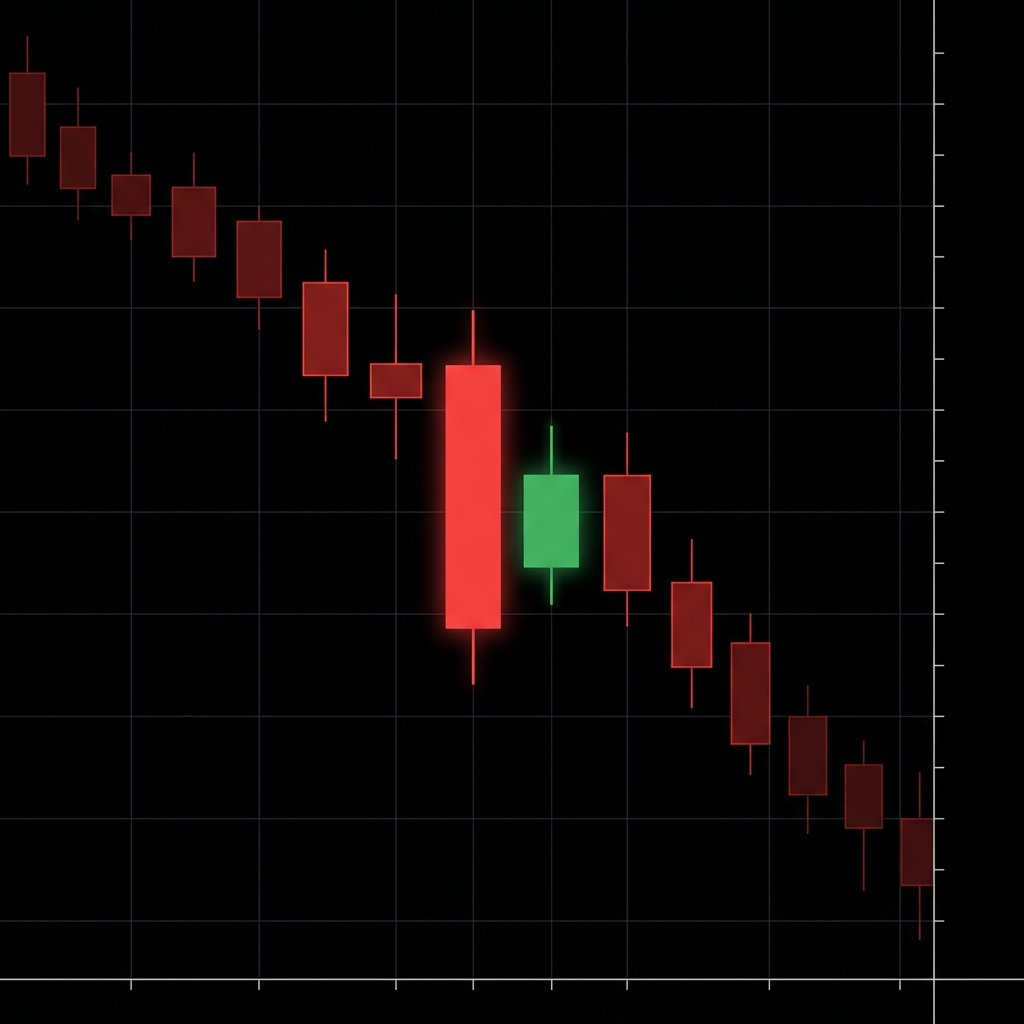
Harami (Bullish & Bearish)
A two-candle pattern where the second candle's body is completely contained within the first candle's body. Bullish harami: large bearish candle followed by a small bullish candle inside it. Bearish h...
Harami (Bullish & Bearish)
A two-candle pattern where the second candle's body is completely contained within the first candle's body. Bullish harami: large bearish candle followed by a small bullish candle inside it. Bearish h...
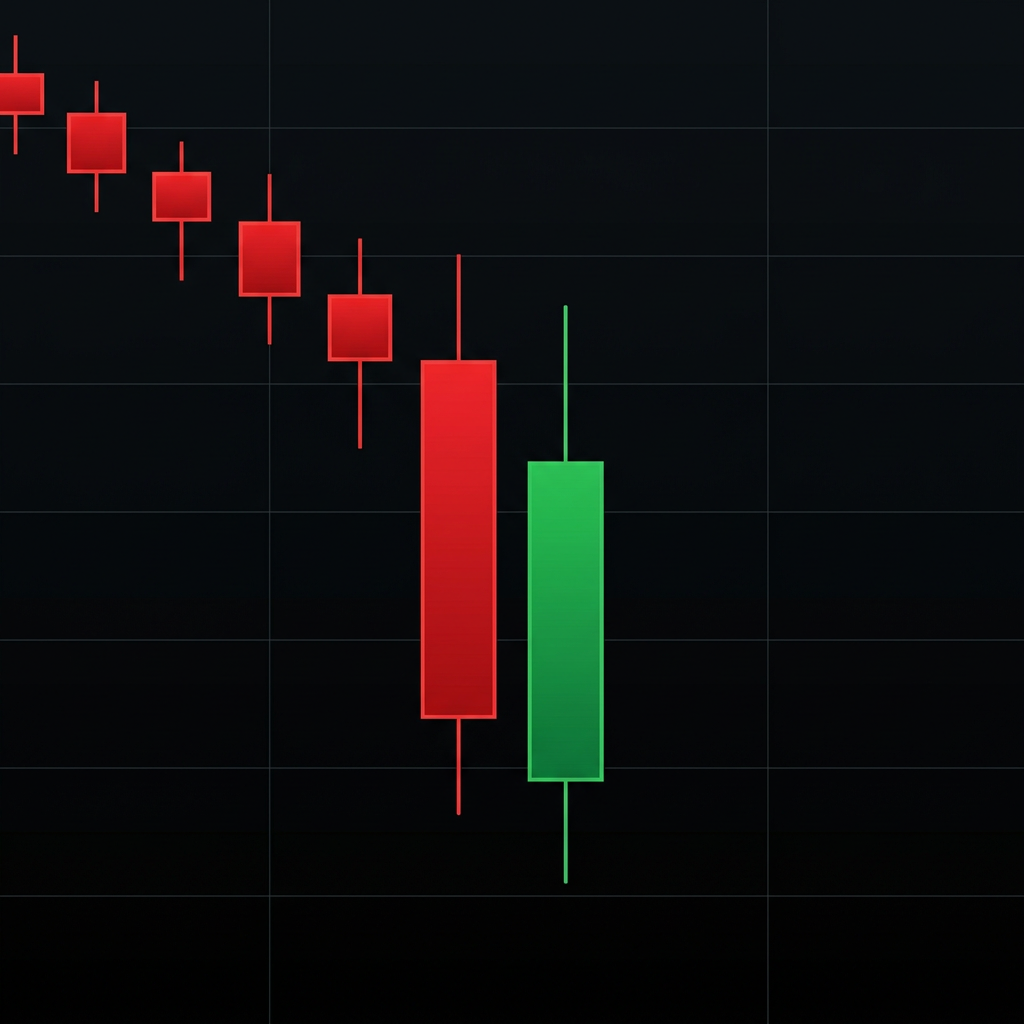
Piercing Pattern
A two-candle bullish reversal: a bearish candle followed by a bullish candle that opens below the prior low but closes above the midpoint of the prior bearish body. Shows buyers fighting back from a w...
Piercing Pattern
A two-candle bullish reversal: a bearish candle followed by a bullish candle that opens below the prior low but closes above the midpoint of the prior bearish body. Shows buyers fighting back from a w...
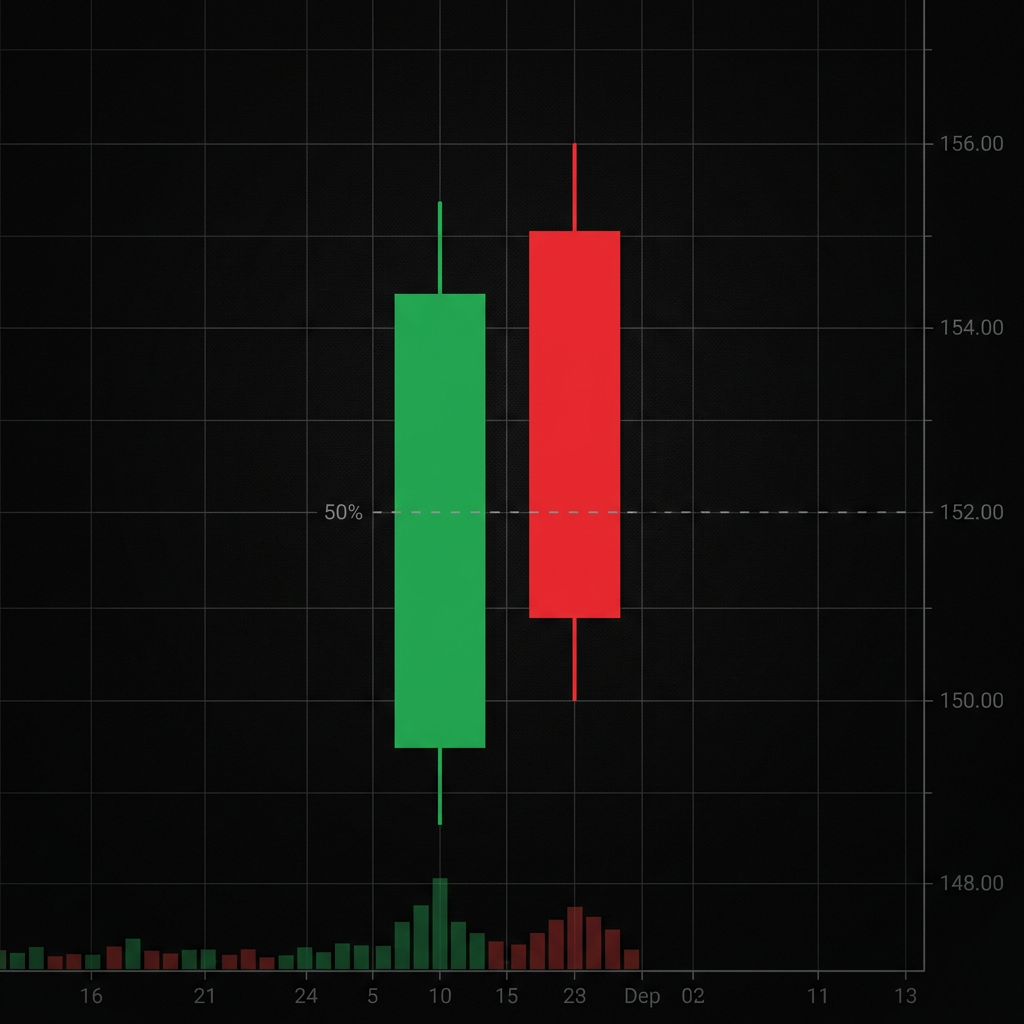
Dark Cloud Cover
The bearish counterpart of the piercing pattern. A bullish candle followed by a bearish candle that opens above the prior high but closes below the midpoint of the prior bullish body.
Dark Cloud Cover
The bearish counterpart of the piercing pattern. A bullish candle followed by a bearish candle that opens above the prior high but closes below the midpoint of the prior bullish body.
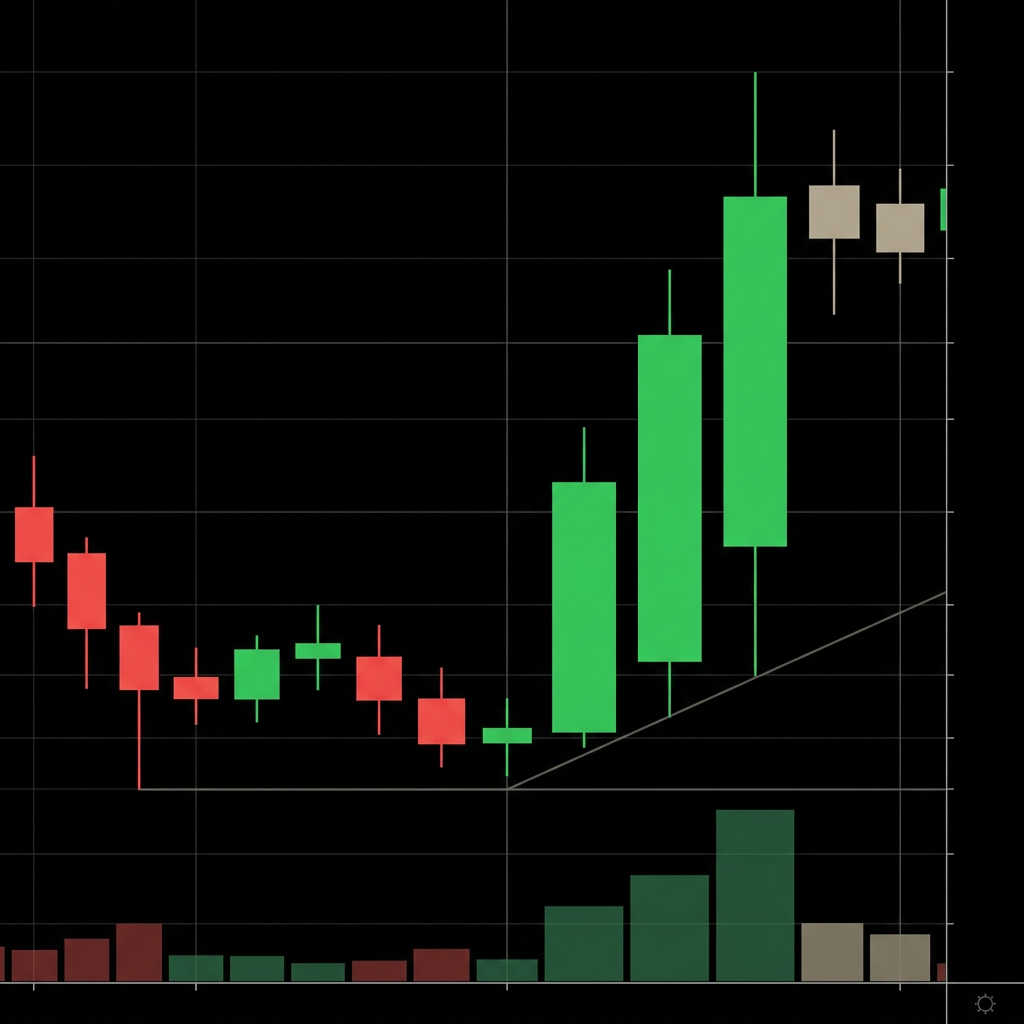
Three White Soldiers
Three consecutive large bullish candles, each opening within the prior body and closing near their highs. Represents sustained, aggressive buying over three sessions. One of the strongest bullish sign...
Three White Soldiers
Three consecutive large bullish candles, each opening within the prior body and closing near their highs. Represents sustained, aggressive buying over three sessions. One of the strongest bullish sign...

Three Black Crows
Three consecutive large bearish candles, each opening within the prior body and closing near their lows. The bearish equivalent of three white soldiers.
Three Black Crows
Three consecutive large bearish candles, each opening within the prior body and closing near their lows. The bearish equivalent of three white soldiers.
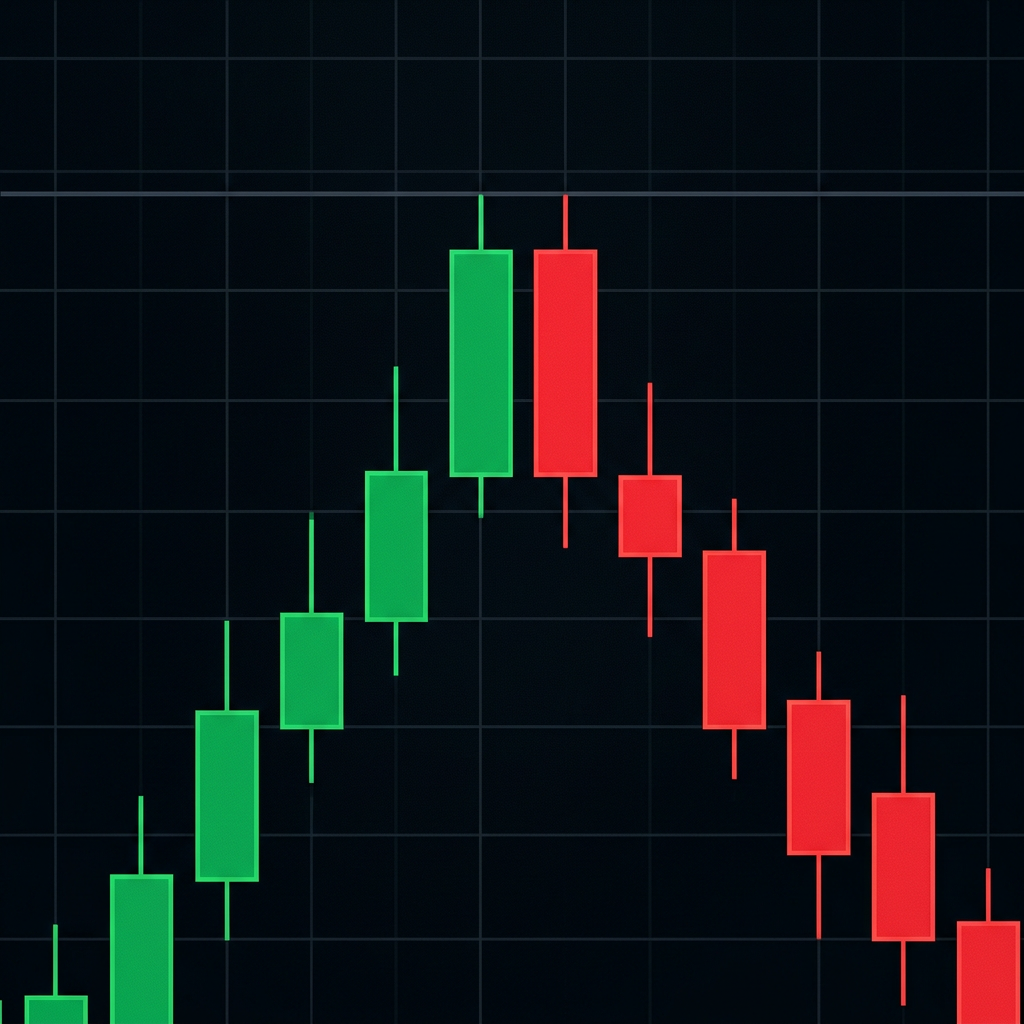
Tweezer Top
Two consecutive candles with matching or near-matching highs. The first is typically bullish and the second bearish. The double rejection of the same price level signals strong resistance.
Tweezer Top
Two consecutive candles with matching or near-matching highs. The first is typically bullish and the second bearish. The double rejection of the same price level signals strong resistance.
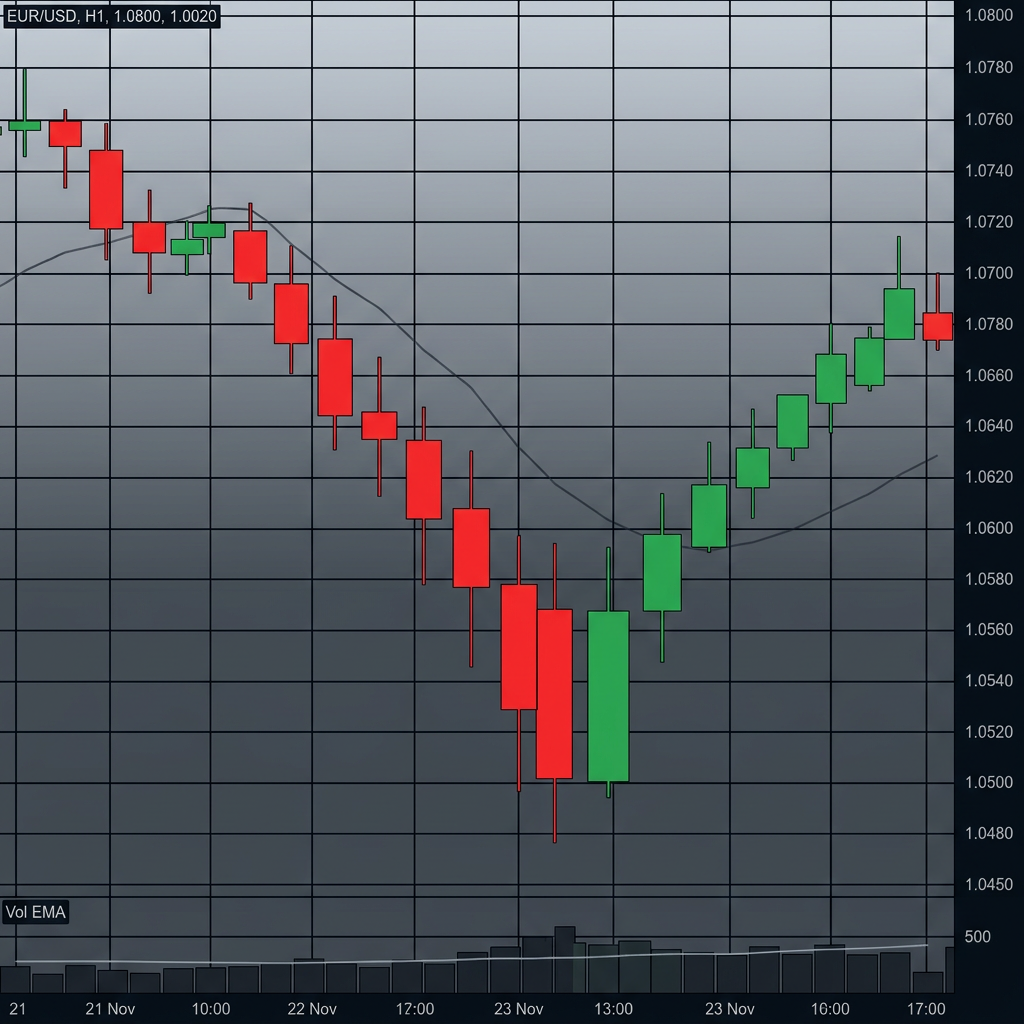
Tweezer Bottom
Two consecutive candles with matching lows. First is bearish, second is bullish. Double rejection of the same low signals strong support.
Tweezer Bottom
Two consecutive candles with matching lows. First is bearish, second is bullish. Double rejection of the same low signals strong support.
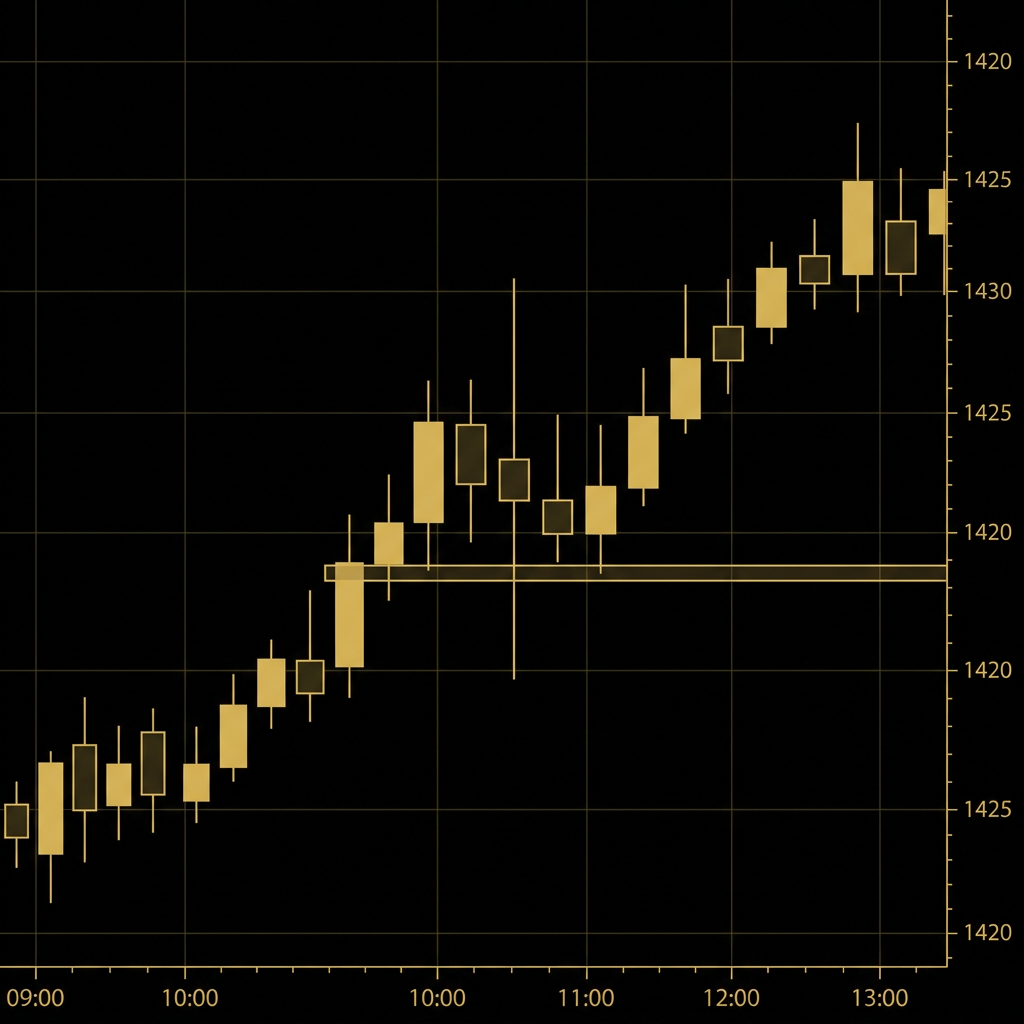
Spinning Top
A candle with a small body and upper and lower shadows of roughly equal length. Similar to a doji but with a visible body. Signals indecision.
Spinning Top
A candle with a small body and upper and lower shadows of roughly equal length. Similar to a doji but with a visible body. Signals indecision.
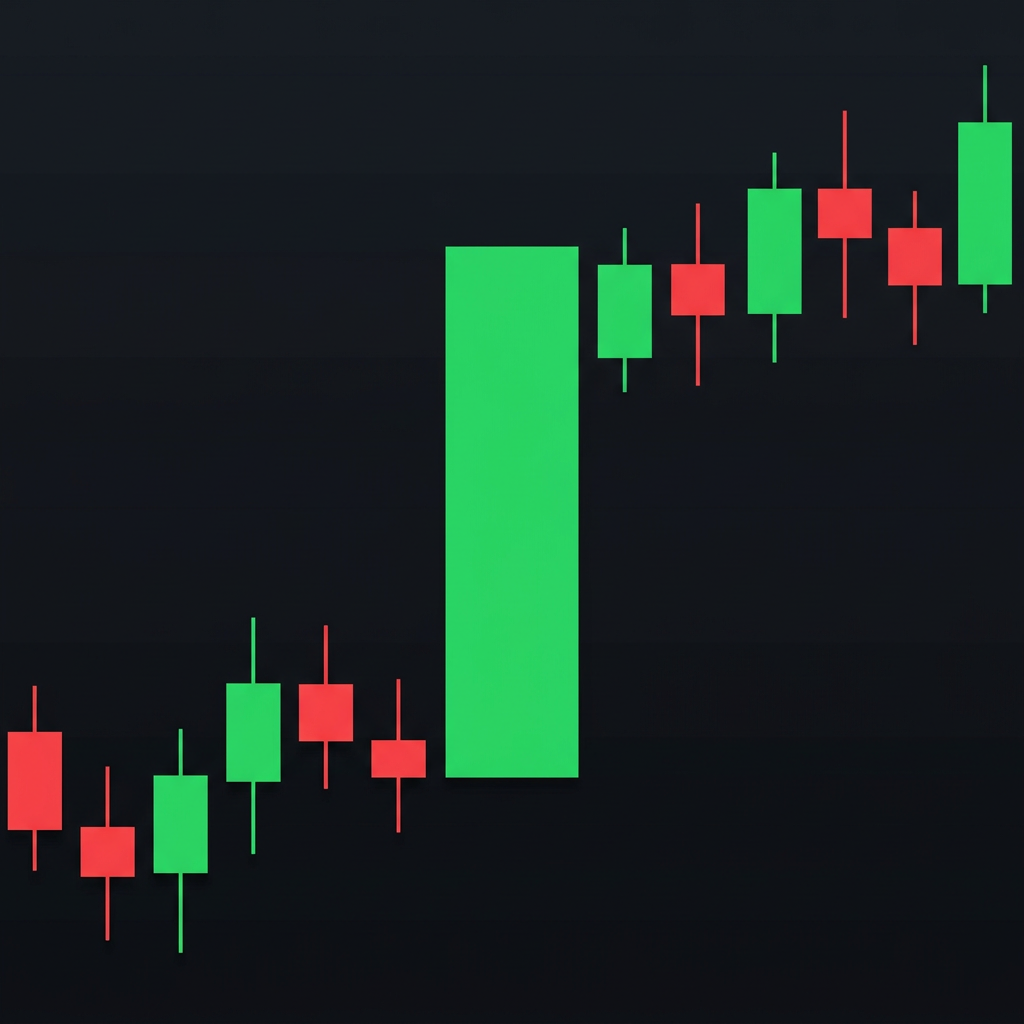
Marubozu
A candle with no shadows (wicks) at all. Bullish marubozu: open = low, close = high. Bearish marubozu: open = high, close = low. Represents total dominance by one side.
Marubozu
A candle with no shadows (wicks) at all. Bullish marubozu: open = low, close = high. Bearish marubozu: open = high, close = low. Represents total dominance by one side.
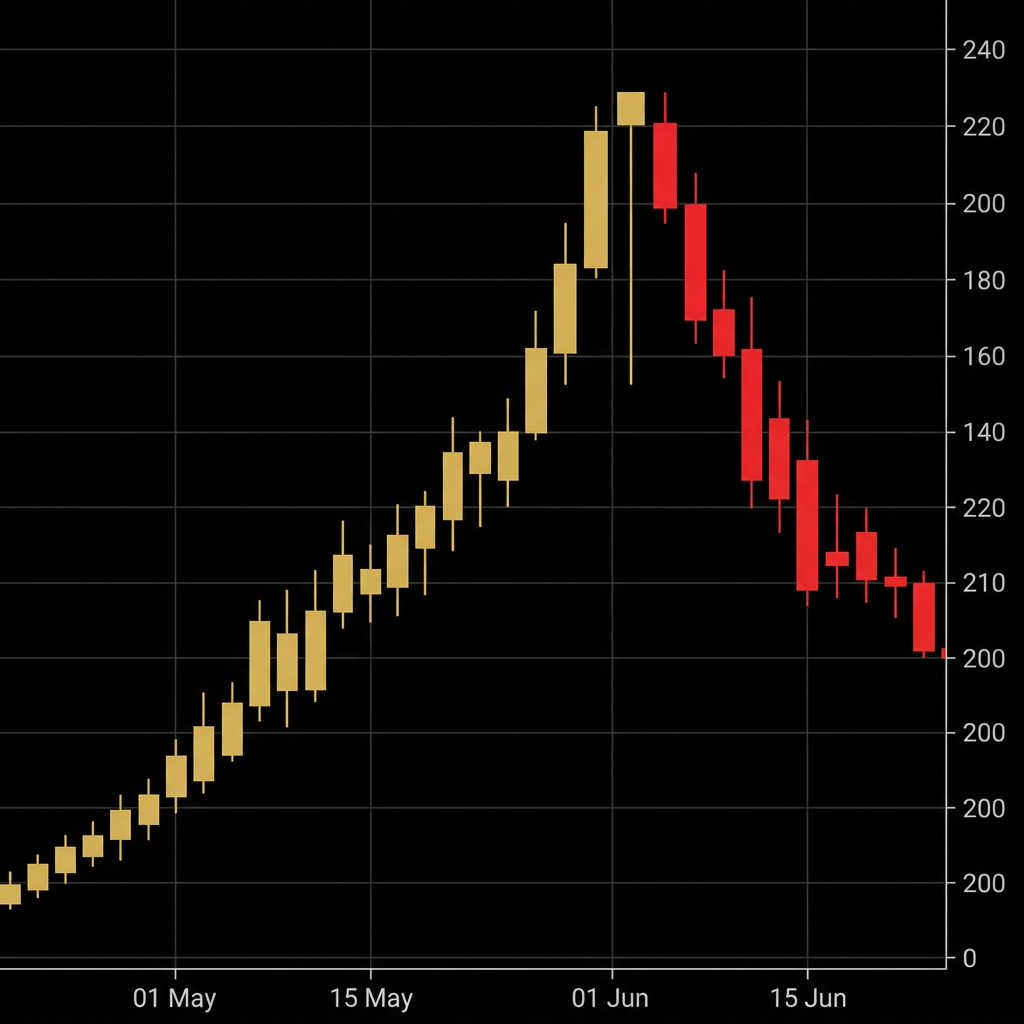
Hanging Man
Looks identical to a hammer but forms at the top of an uptrend. Small body at the top, long lower shadow. The fact that sellers could push price so far down during a rally is a warning.
Hanging Man
Looks identical to a hammer but forms at the top of an uptrend. Small body at the top, long lower shadow. The fact that sellers could push price so far down during a rally is a warning.
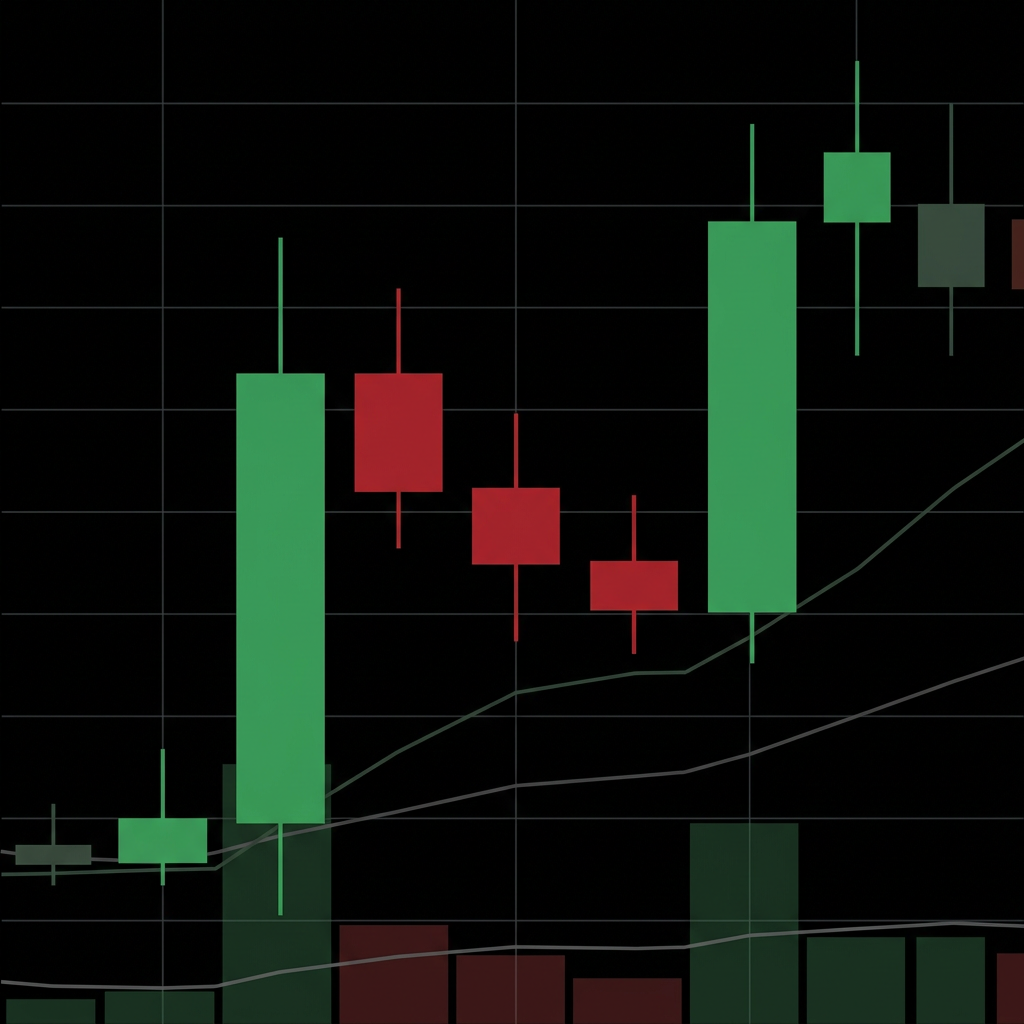
Rising Three Methods
A five-candle bullish continuation pattern: a large bullish candle, followed by three small bearish candles that stay within the first candle's range, then another large bullish candle that closes abo...
Rising Three Methods
A five-candle bullish continuation pattern: a large bullish candle, followed by three small bearish candles that stay within the first candle's range, then another large bullish candle that closes abo...
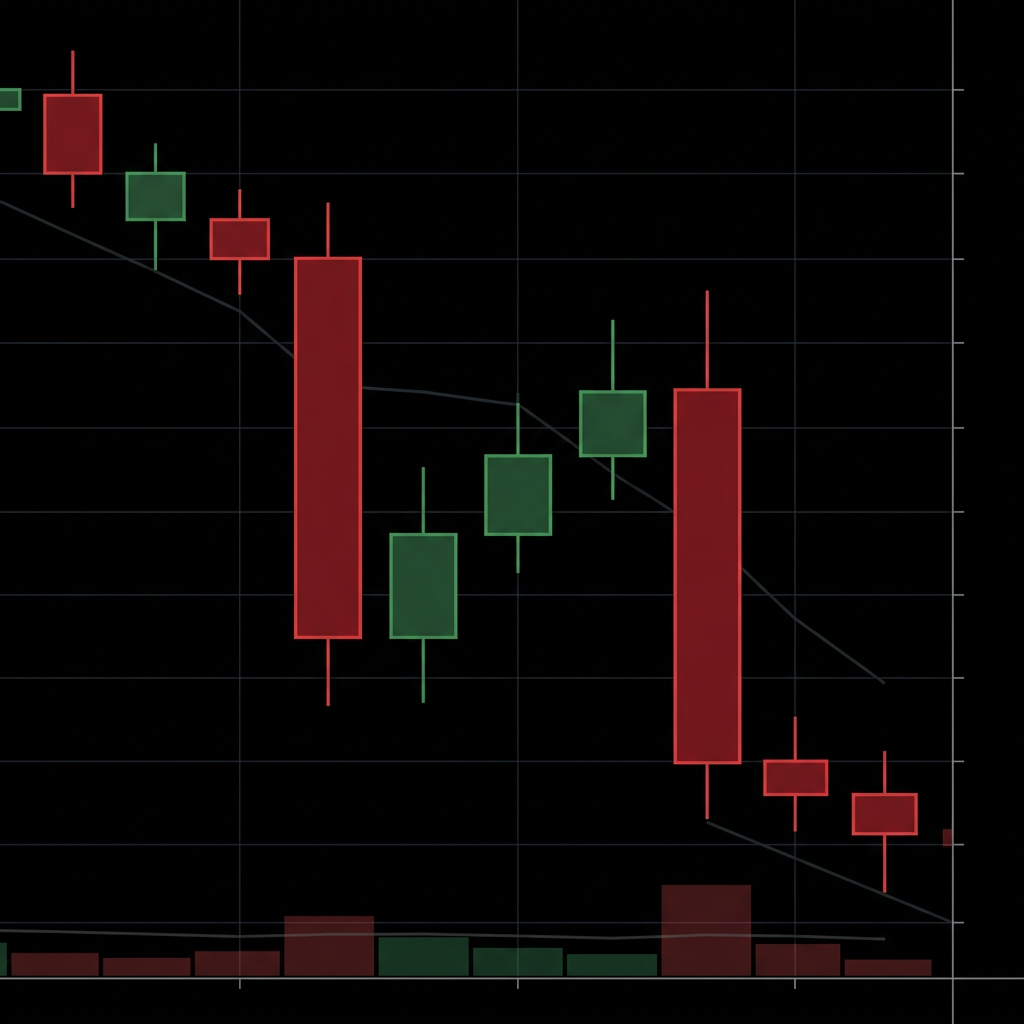
Falling Three Methods
The bearish counterpart: a large bearish candle, three small bullish candles within its range, then another large bearish candle closing below the first.
Falling Three Methods
The bearish counterpart: a large bearish candle, three small bullish candles within its range, then another large bearish candle closing below the first.
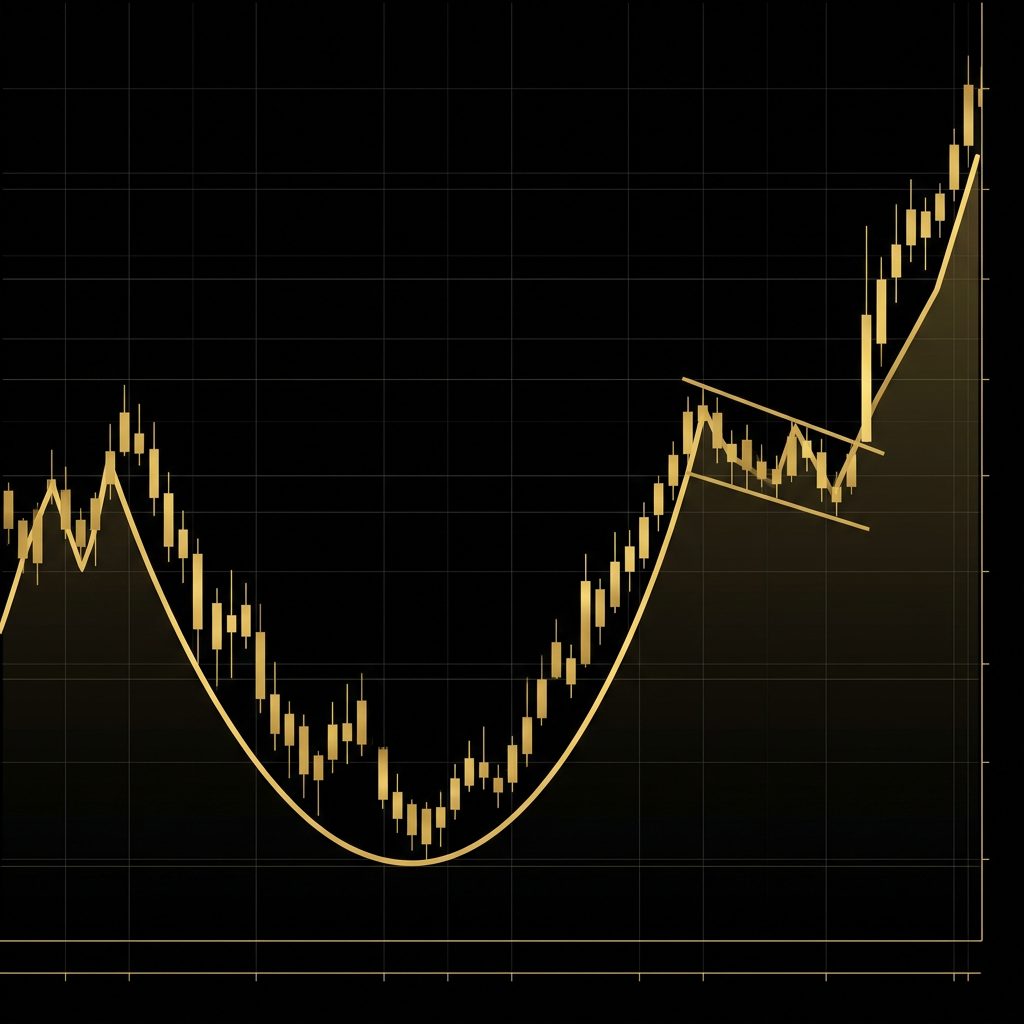
Cup and Handle
A bullish continuation pattern shaped like a tea cup with a handle. The 'cup' is a rounded bottom that forms over weeks to months. The 'handle' is a small downward drift before the breakout above the ...
Cup and Handle
A bullish continuation pattern shaped like a tea cup with a handle. The 'cup' is a rounded bottom that forms over weeks to months. The 'handle' is a small downward drift before the breakout above the ...
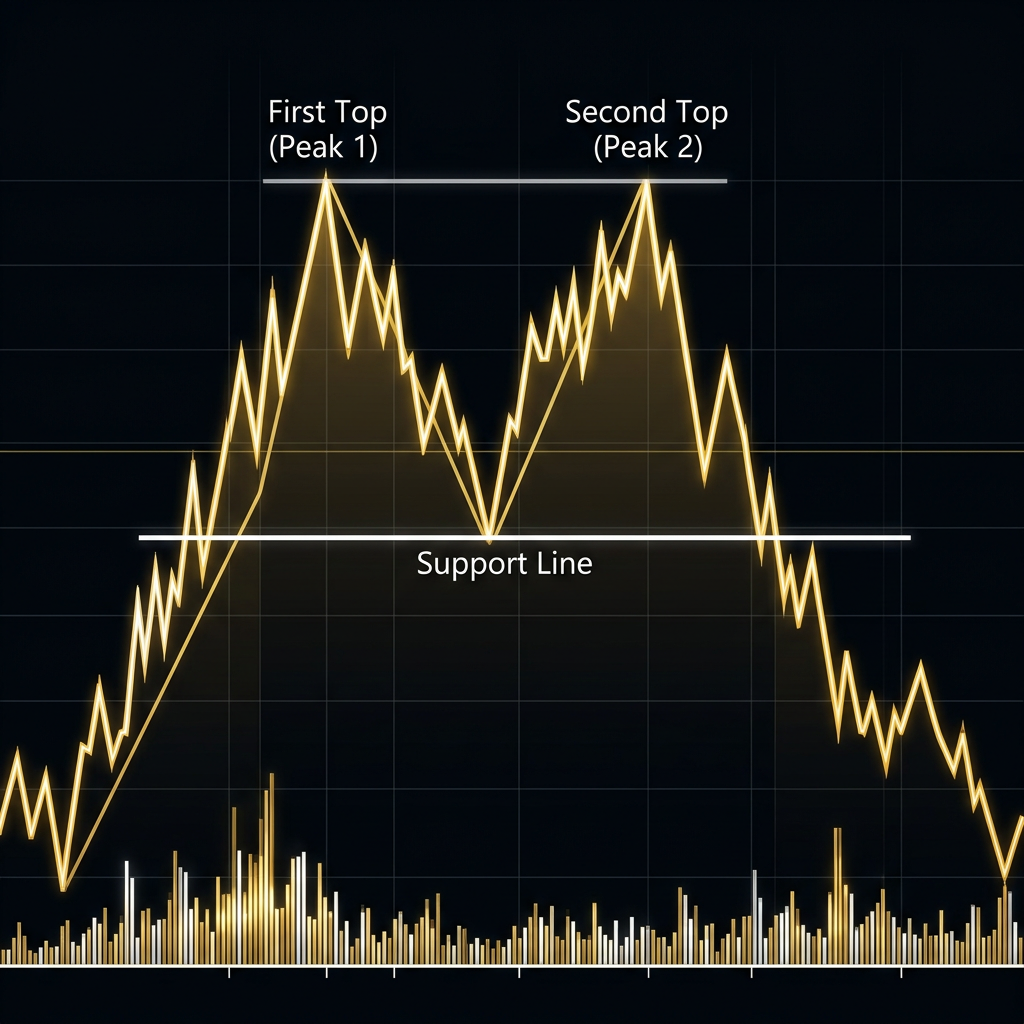
Double Top
Price reaches a high, pulls back, rallies to the same high again but fails to break through, then reverses. Creates an 'M' shape. The 'neckline' is the support at the pullback low between the two peak...
Double Top
Price reaches a high, pulls back, rallies to the same high again but fails to break through, then reverses. Creates an 'M' shape. The 'neckline' is the support at the pullback low between the two peak...
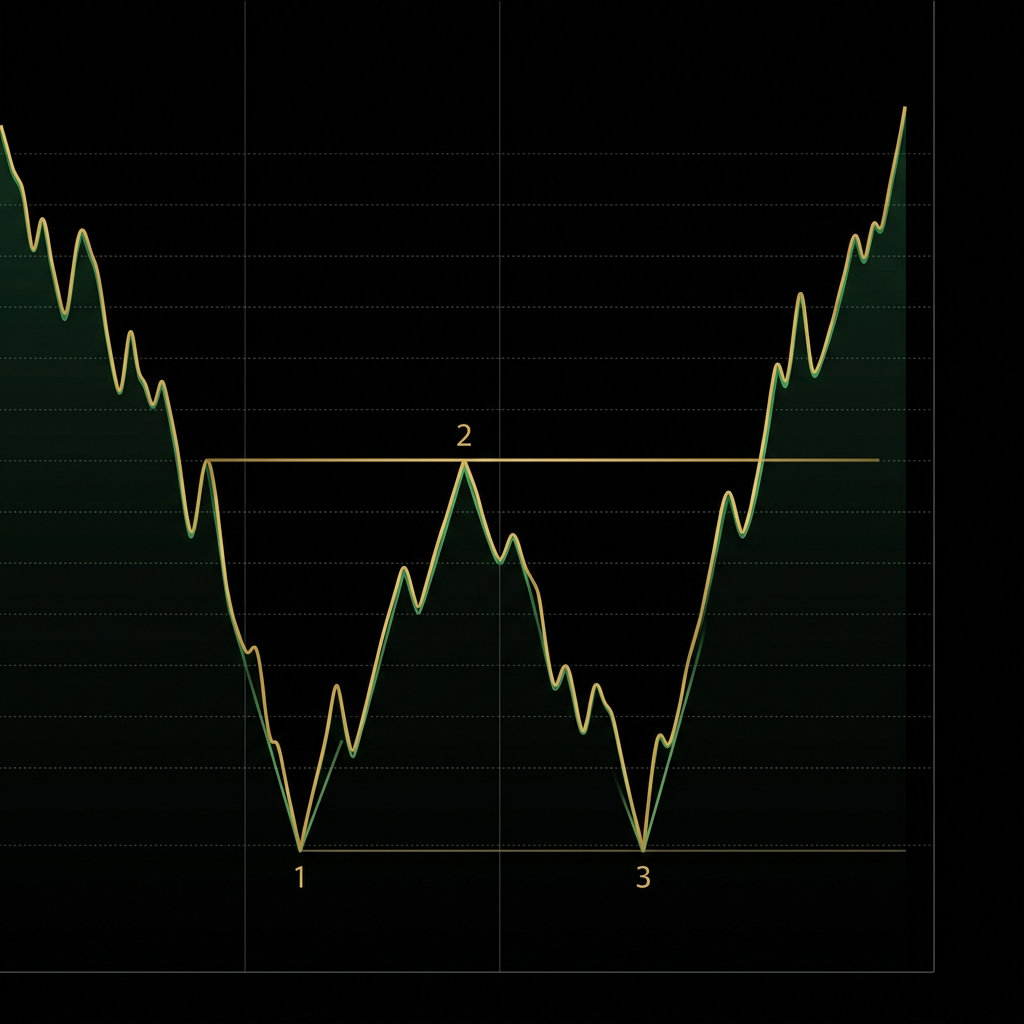
Double Bottom
Price hits a low, bounces, drops to the same low again, holds, then reverses upward. Creates a 'W' shape. The neckline is the resistance at the bounce high between the two bottoms.
Double Bottom
Price hits a low, bounces, drops to the same low again, holds, then reverses upward. Creates a 'W' shape. The neckline is the resistance at the bounce high between the two bottoms.
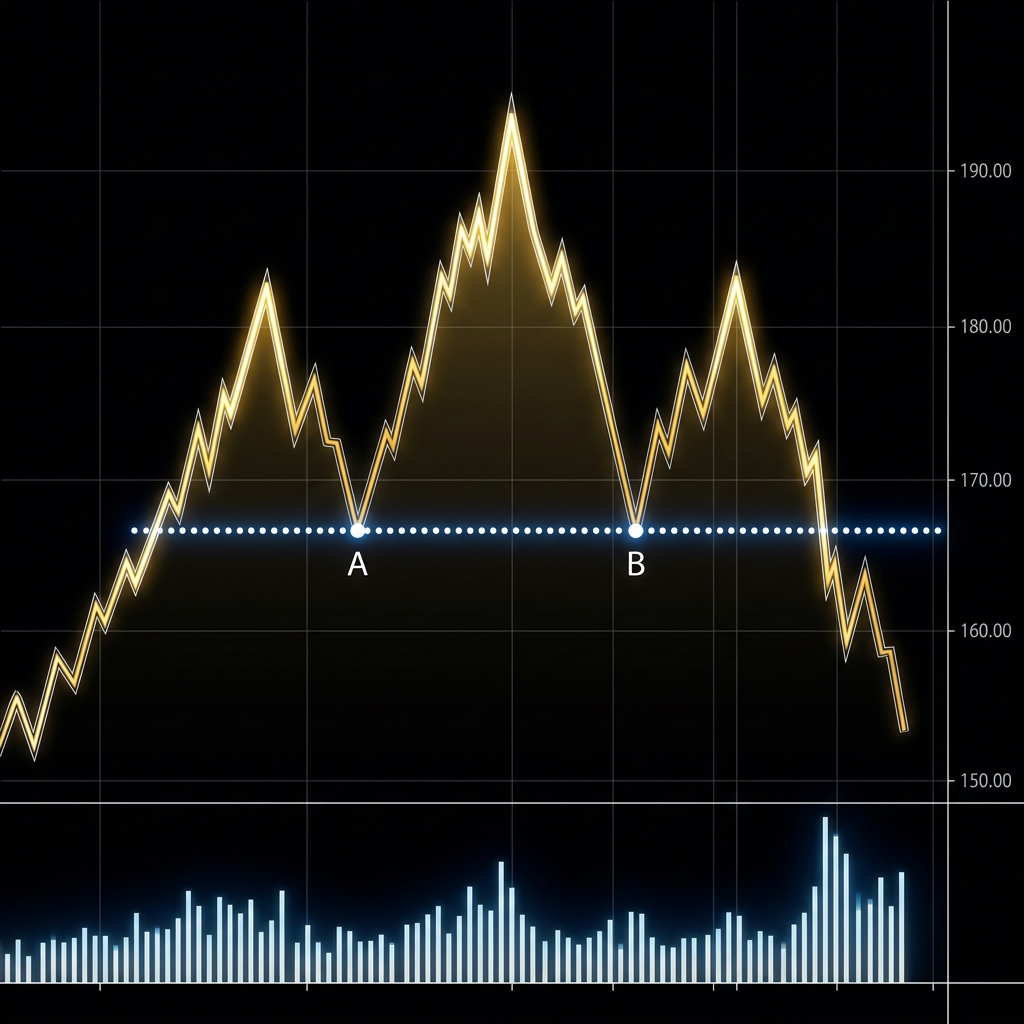
Head and Shoulders
Three peaks: the middle peak (head) is higher than the two side peaks (shoulders). The neckline connects the lows between the peaks. A break below the neckline confirms the bearish reversal. One of th...
Head and Shoulders
Three peaks: the middle peak (head) is higher than the two side peaks (shoulders). The neckline connects the lows between the peaks. A break below the neckline confirms the bearish reversal. One of th...
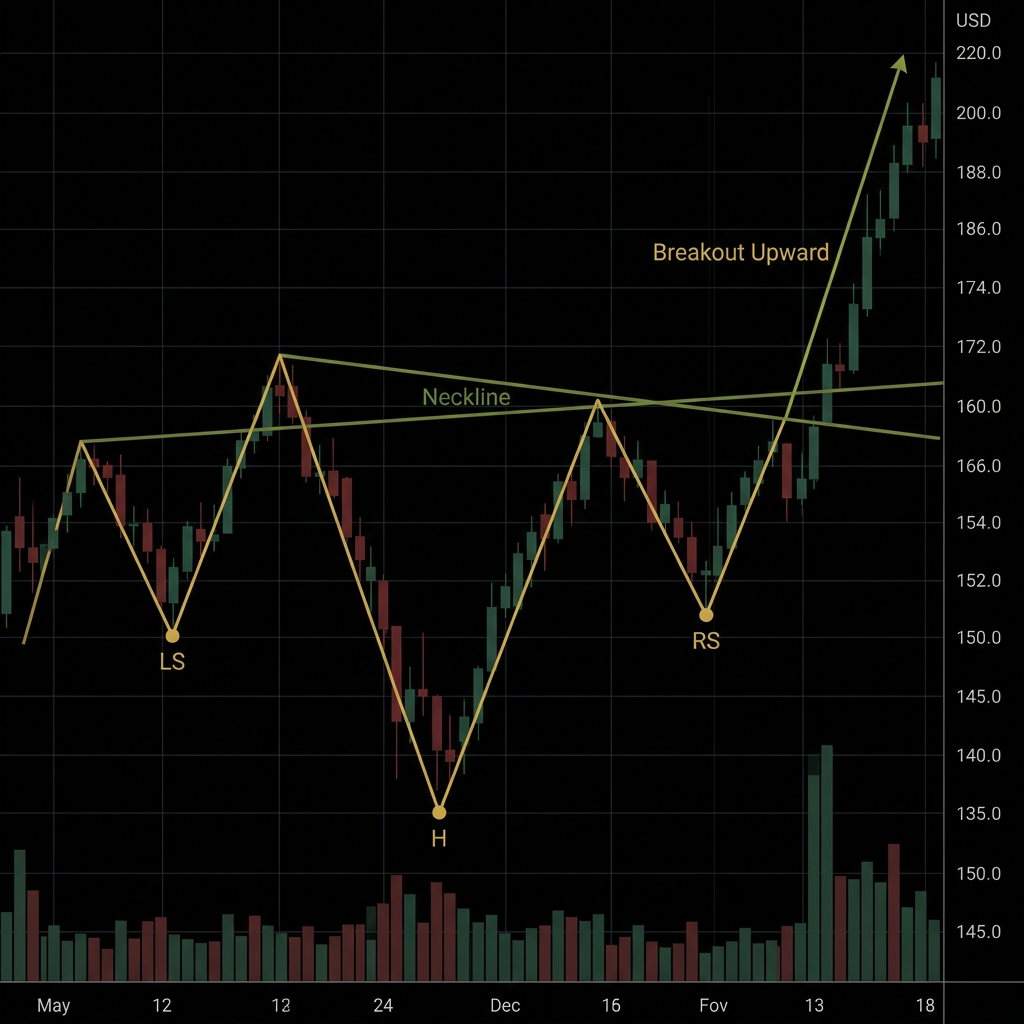
Inverse Head and Shoulders
The bullish mirror of head and shoulders. Three troughs: the middle (head) is lower than the two sides (shoulders). Break above the neckline signals bullish reversal.
Inverse Head and Shoulders
The bullish mirror of head and shoulders. Three troughs: the middle (head) is lower than the two sides (shoulders). Break above the neckline signals bullish reversal.
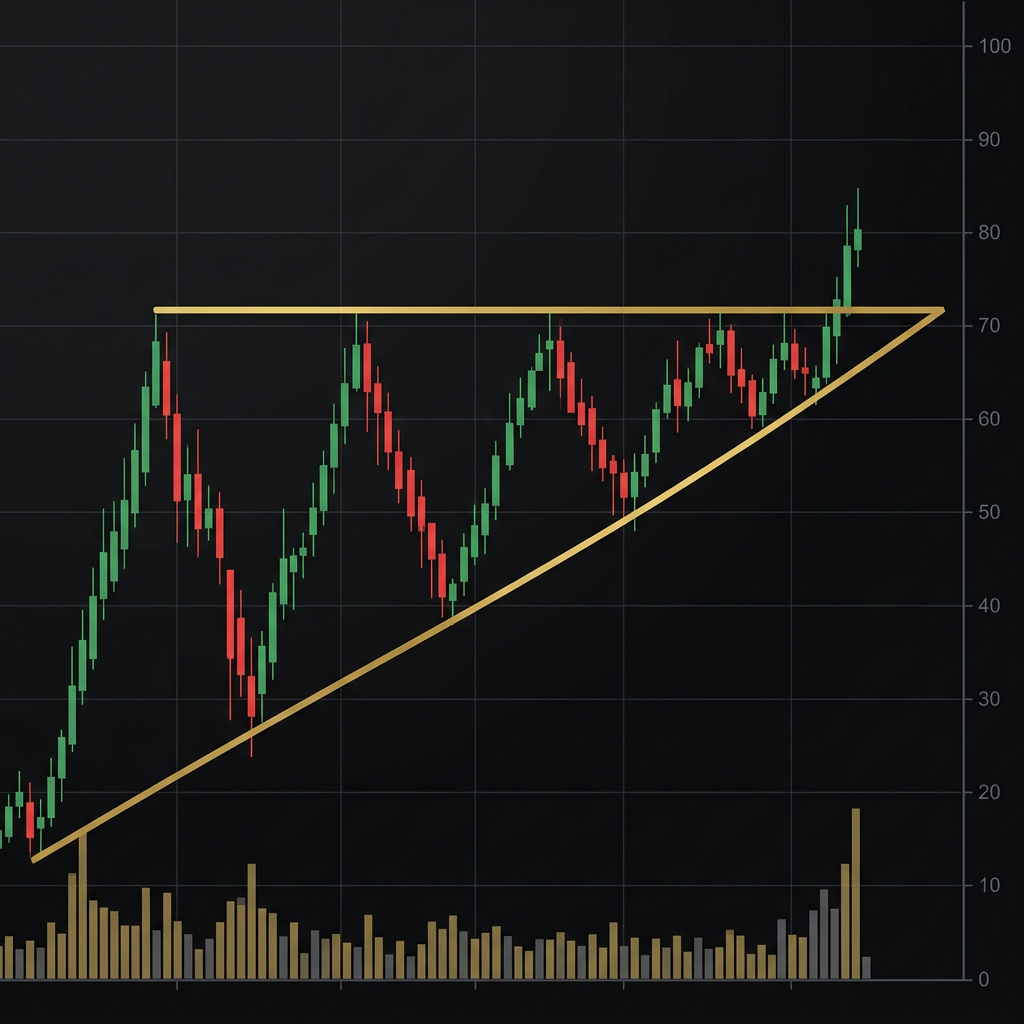
Ascending Triangle
A flat resistance line on top with rising support (higher lows) below. Price gets squeezed into the apex. Typically breaks upward through the flat resistance. A powerful bullish continuation pattern.
Ascending Triangle
A flat resistance line on top with rising support (higher lows) below. Price gets squeezed into the apex. Typically breaks upward through the flat resistance. A powerful bullish continuation pattern.
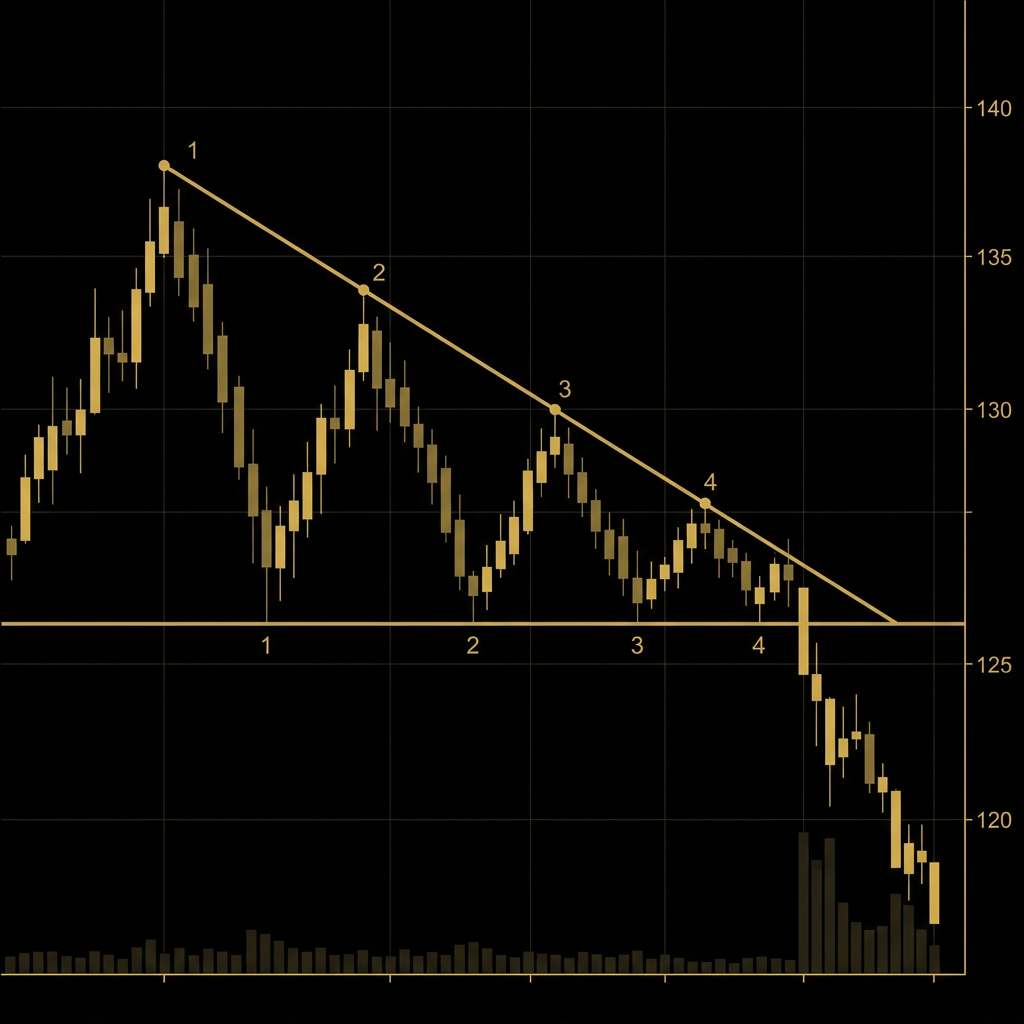
Descending Triangle
Flat support on the bottom with descending resistance (lower highs) above. Typically breaks downward through the flat support.
Descending Triangle
Flat support on the bottom with descending resistance (lower highs) above. Typically breaks downward through the flat support.
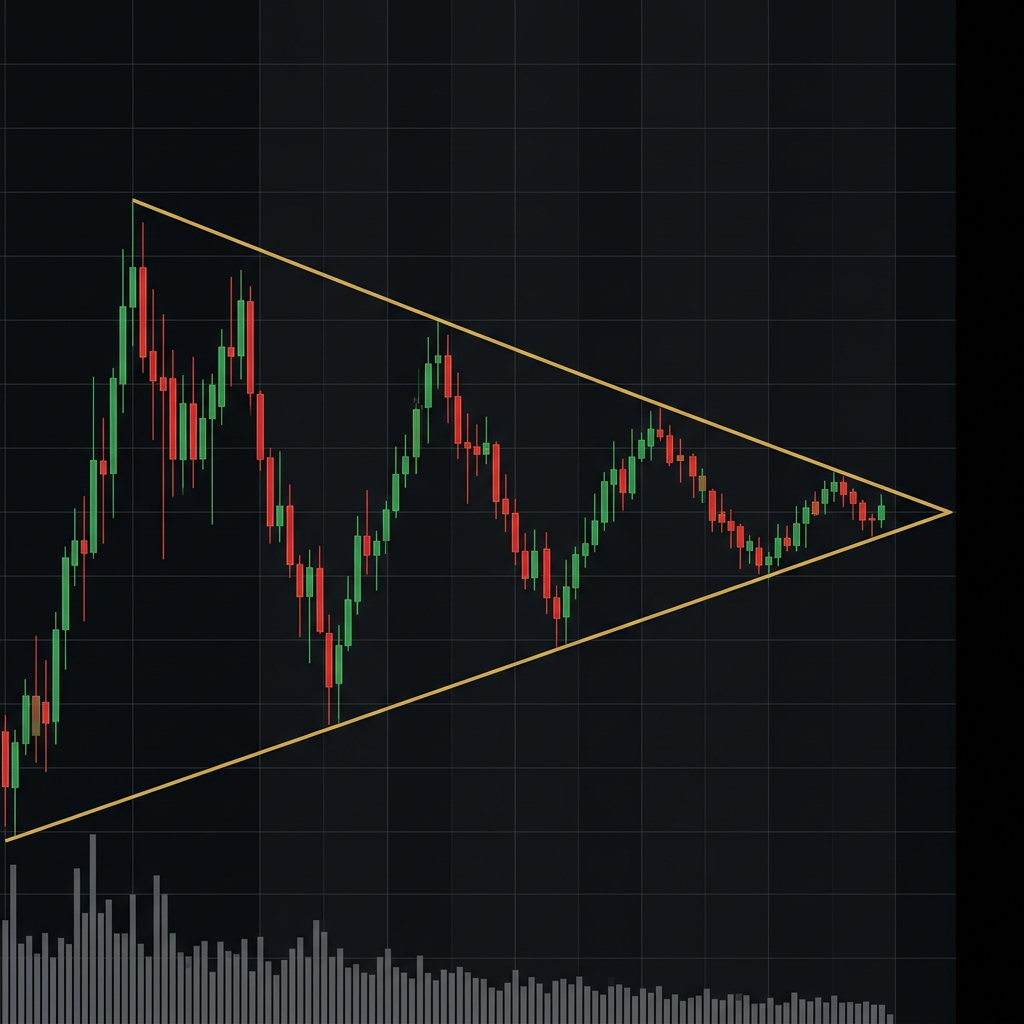
Symmetrical Triangle
Converging trendlines with lower highs and higher lows creating a symmetrical shape. Price is compressing into the apex. Can break in either direction, but tends to continue the prior trend (60/40 odd...
Symmetrical Triangle
Converging trendlines with lower highs and higher lows creating a symmetrical shape. Price is compressing into the apex. Can break in either direction, but tends to continue the prior trend (60/40 odd...
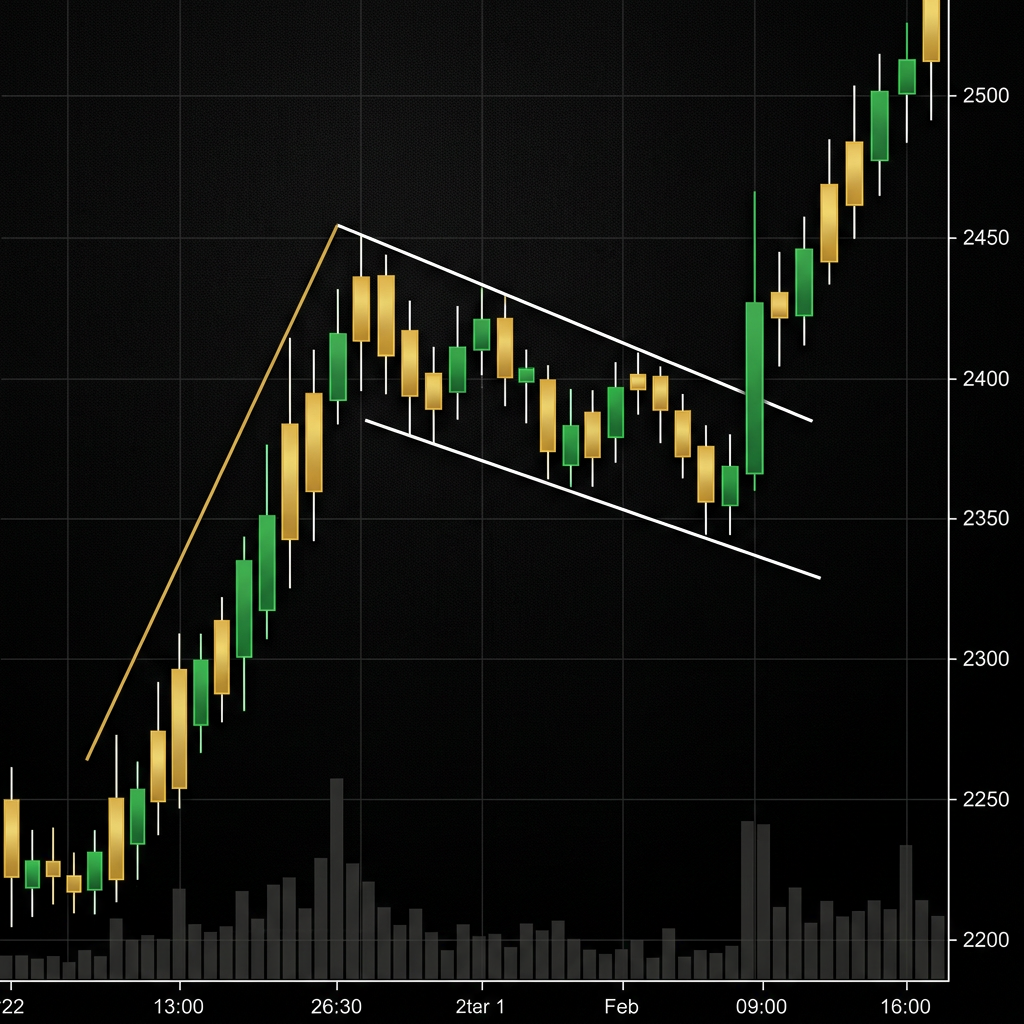
Bull Flag
A sharp rally (the 'flagpole') followed by a tight, downward-sloping consolidation (the 'flag'). The flag should retrace 30-50% of the flagpole. One of the most reliable continuation patterns.
Bull Flag
A sharp rally (the 'flagpole') followed by a tight, downward-sloping consolidation (the 'flag'). The flag should retrace 30-50% of the flagpole. One of the most reliable continuation patterns.
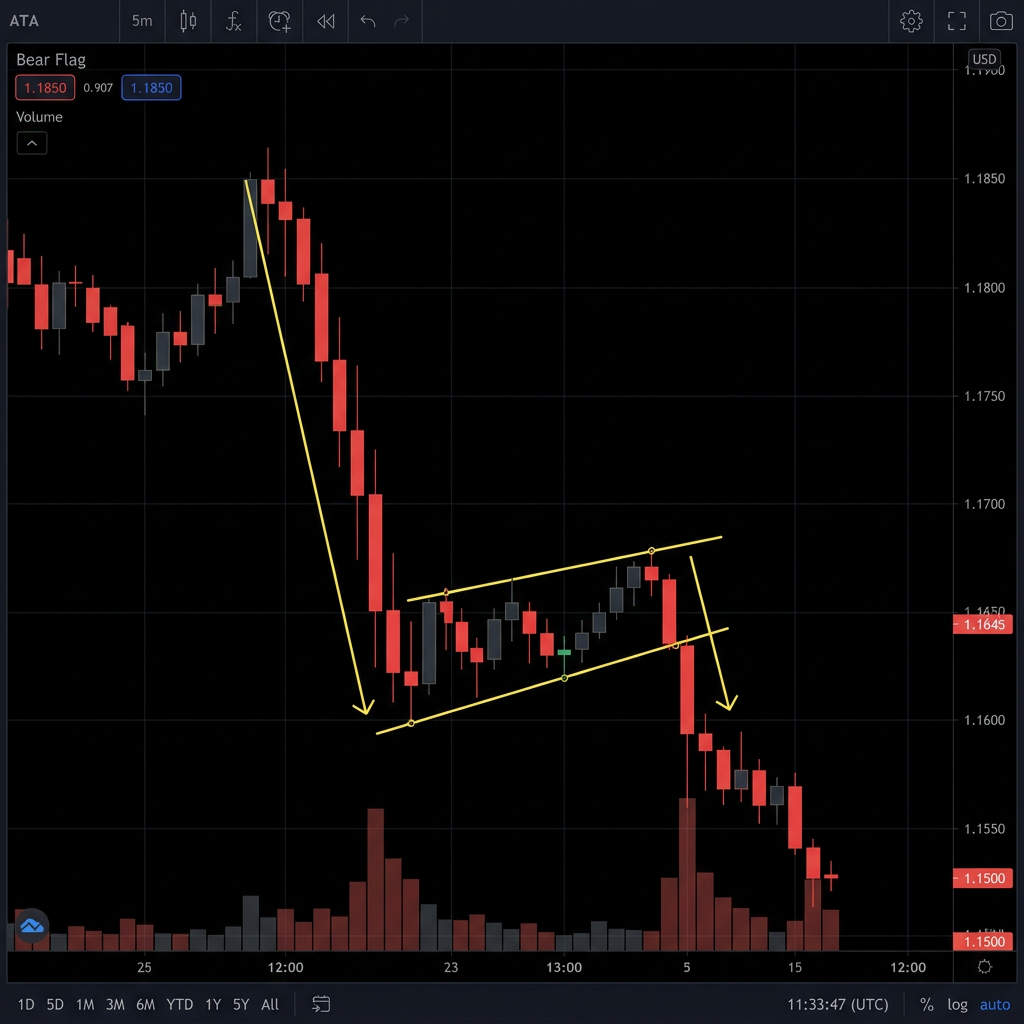
Bear Flag
A sharp decline (flagpole) followed by a slight upward-sloping consolidation (flag). Breaks down to continue the bearish trend.
Bear Flag
A sharp decline (flagpole) followed by a slight upward-sloping consolidation (flag). Breaks down to continue the bearish trend.
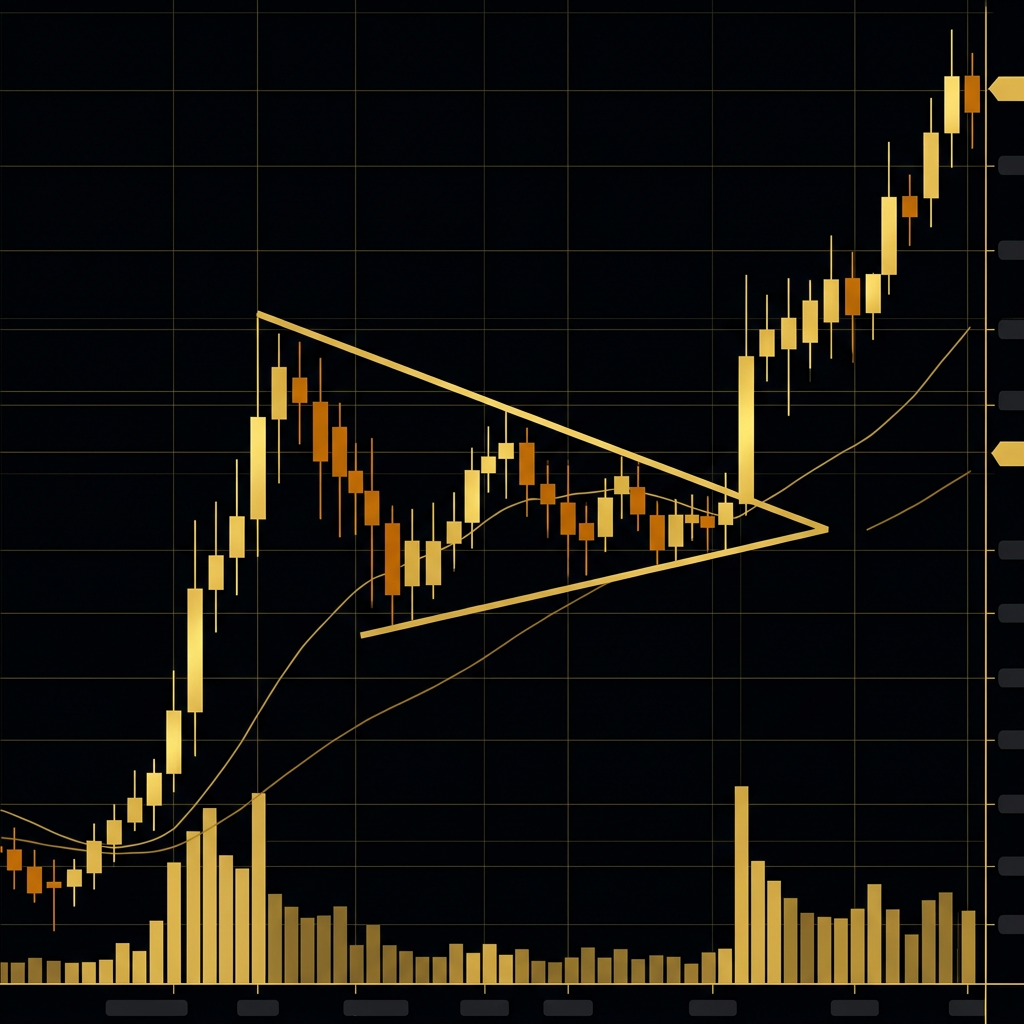
Pennant
Similar to a flag but the consolidation forms a small symmetrical triangle rather than a rectangle. Converging trendlines after a strong move (flagpole). Breaks in the direction of the flagpole.
Pennant
Similar to a flag but the consolidation forms a small symmetrical triangle rather than a rectangle. Converging trendlines after a strong move (flagpole). Breaks in the direction of the flagpole.
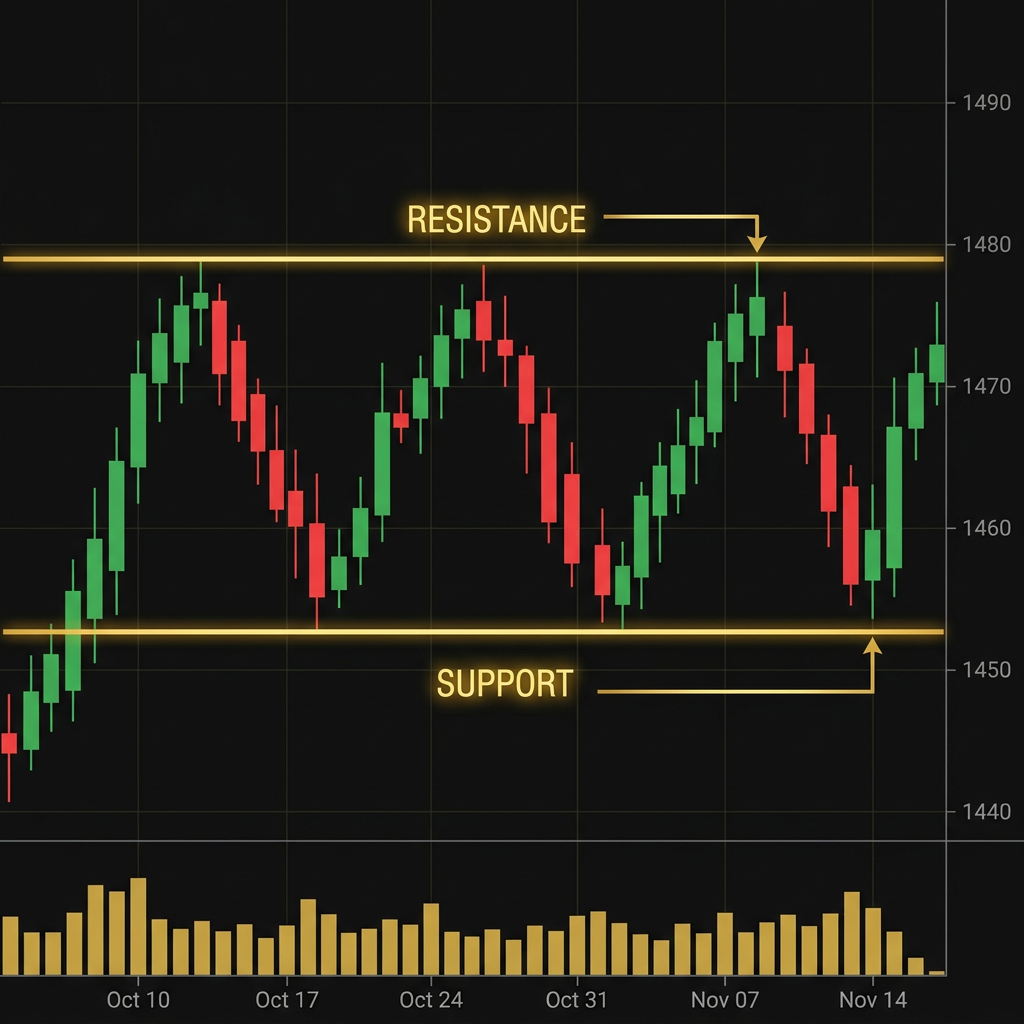
Rectangle (Range)
Price oscillates between horizontal support and resistance, creating a box or rectangle shape. Can break in either direction but tends to continue the prior trend.
Rectangle (Range)
Price oscillates between horizontal support and resistance, creating a box or rectangle shape. Can break in either direction but tends to continue the prior trend.
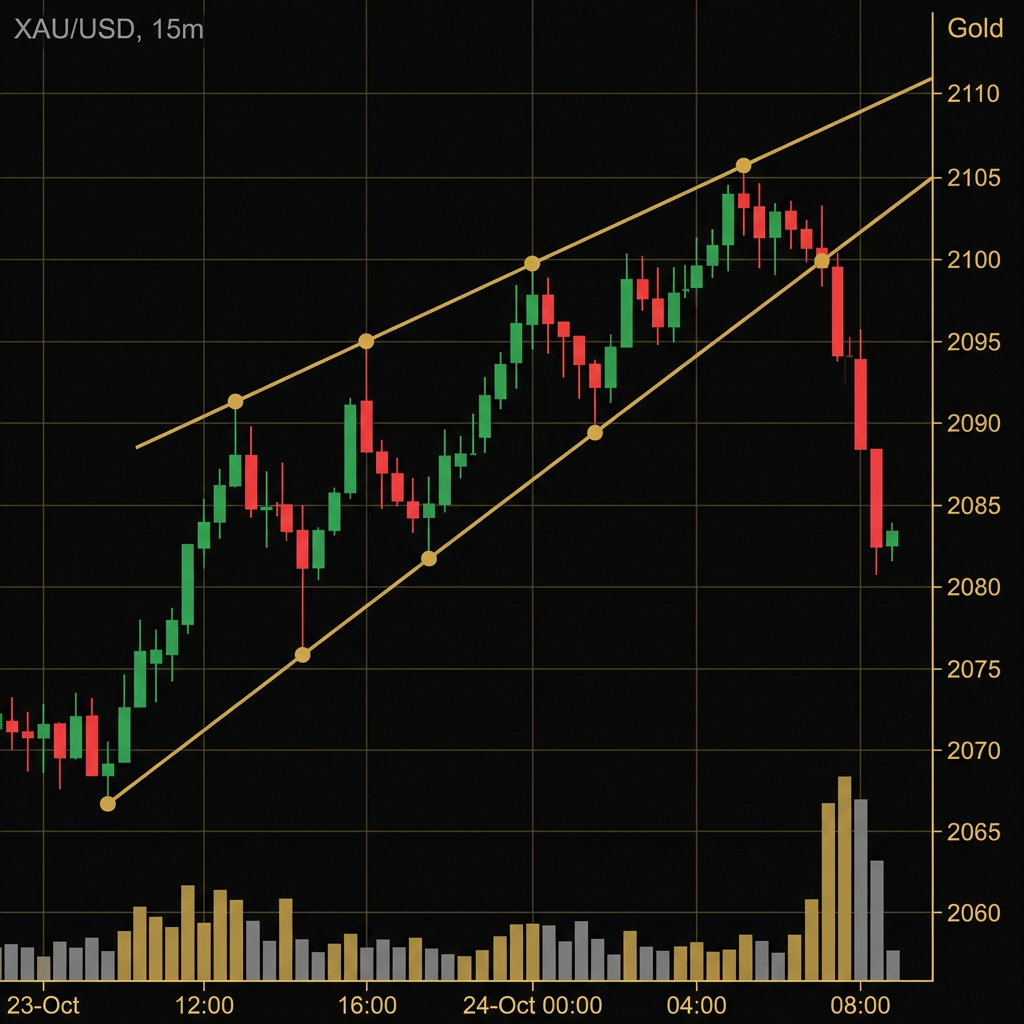
Rising Wedge
Both support and resistance lines slope upward, but support rises faster, creating a narrowing pattern. Despite making higher highs and higher lows, the pattern is bearish — the upside is weakening.
Rising Wedge
Both support and resistance lines slope upward, but support rises faster, creating a narrowing pattern. Despite making higher highs and higher lows, the pattern is bearish — the upside is weakening.
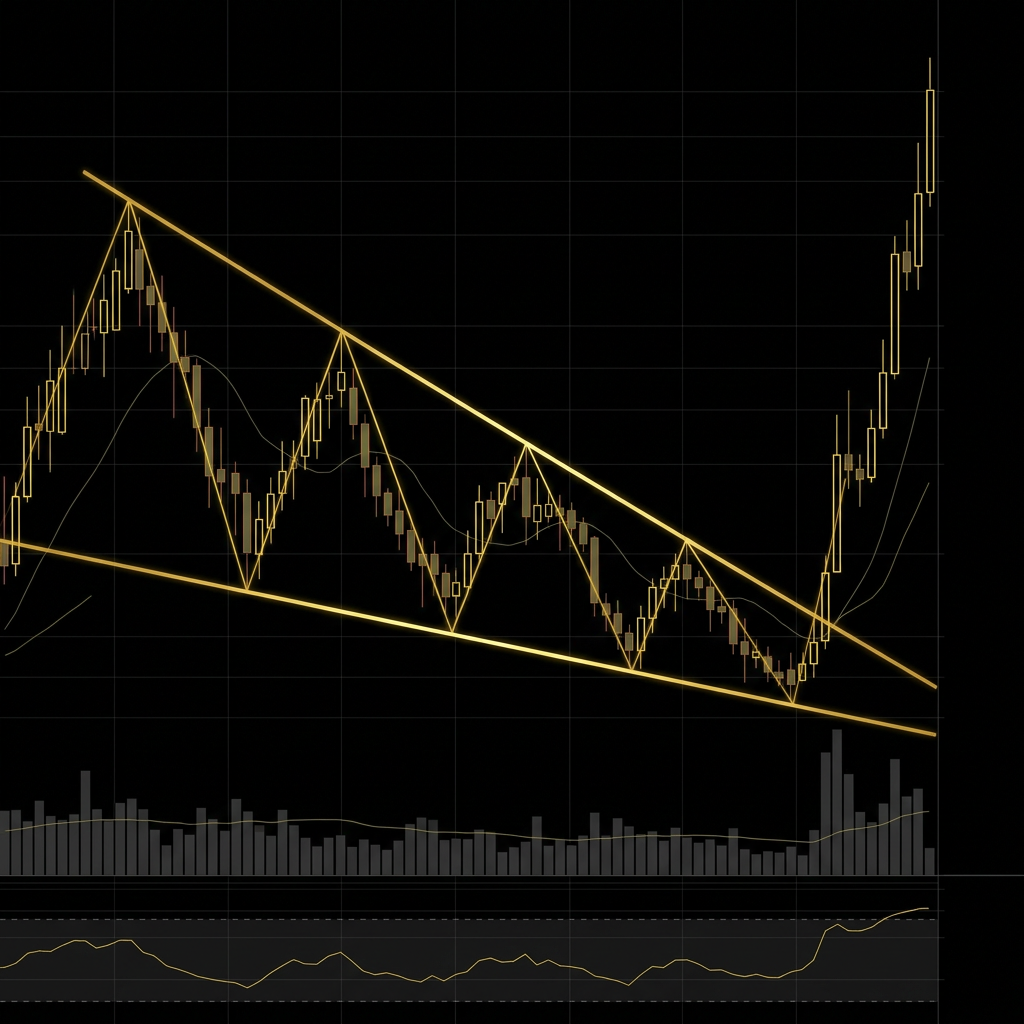
Falling Wedge
Both trendlines slope downward, with resistance falling faster than support. Despite lower highs and lower lows, this pattern is bullish — selling pressure is weakening.
Falling Wedge
Both trendlines slope downward, with resistance falling faster than support. Despite lower highs and lower lows, this pattern is bullish — selling pressure is weakening.
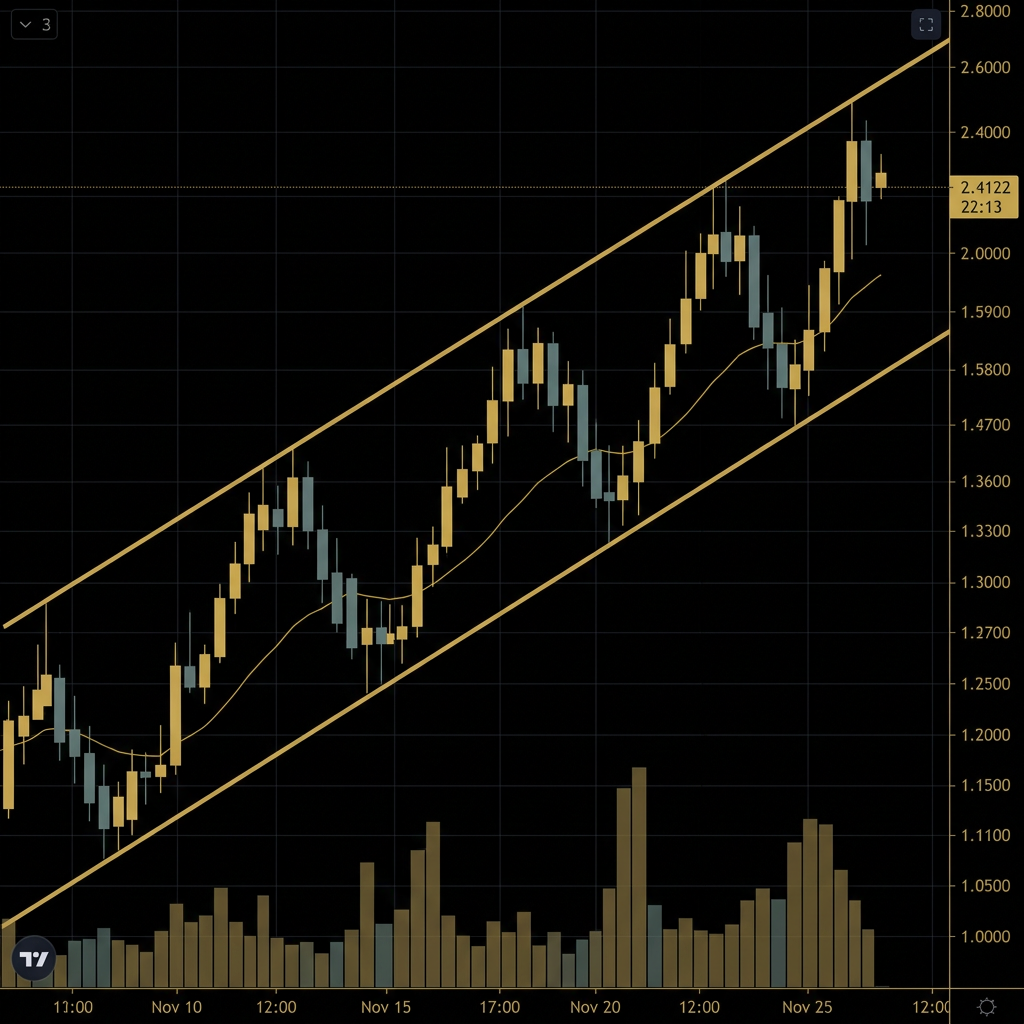
Ascending Channel
Two parallel upward-sloping trendlines containing price action. The lower line is support, the upper line is resistance. Price oscillates between the two within the uptrend.
Ascending Channel
Two parallel upward-sloping trendlines containing price action. The lower line is support, the upper line is resistance. Price oscillates between the two within the uptrend.
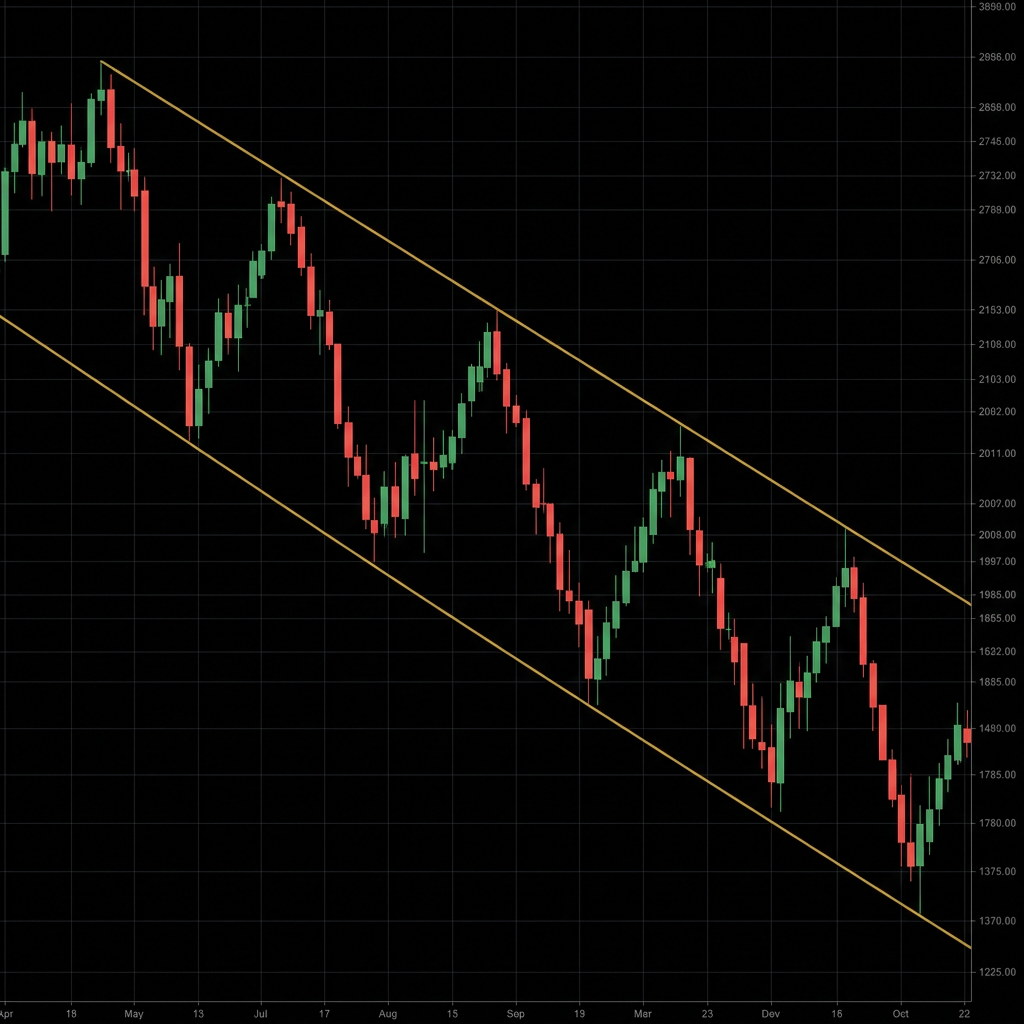
Descending Channel
Two parallel downward-sloping trendlines. Price oscillates within this controlled downtrend. Break above the upper line signals potential reversal.
Descending Channel
Two parallel downward-sloping trendlines. Price oscillates within this controlled downtrend. Break above the upper line signals potential reversal.
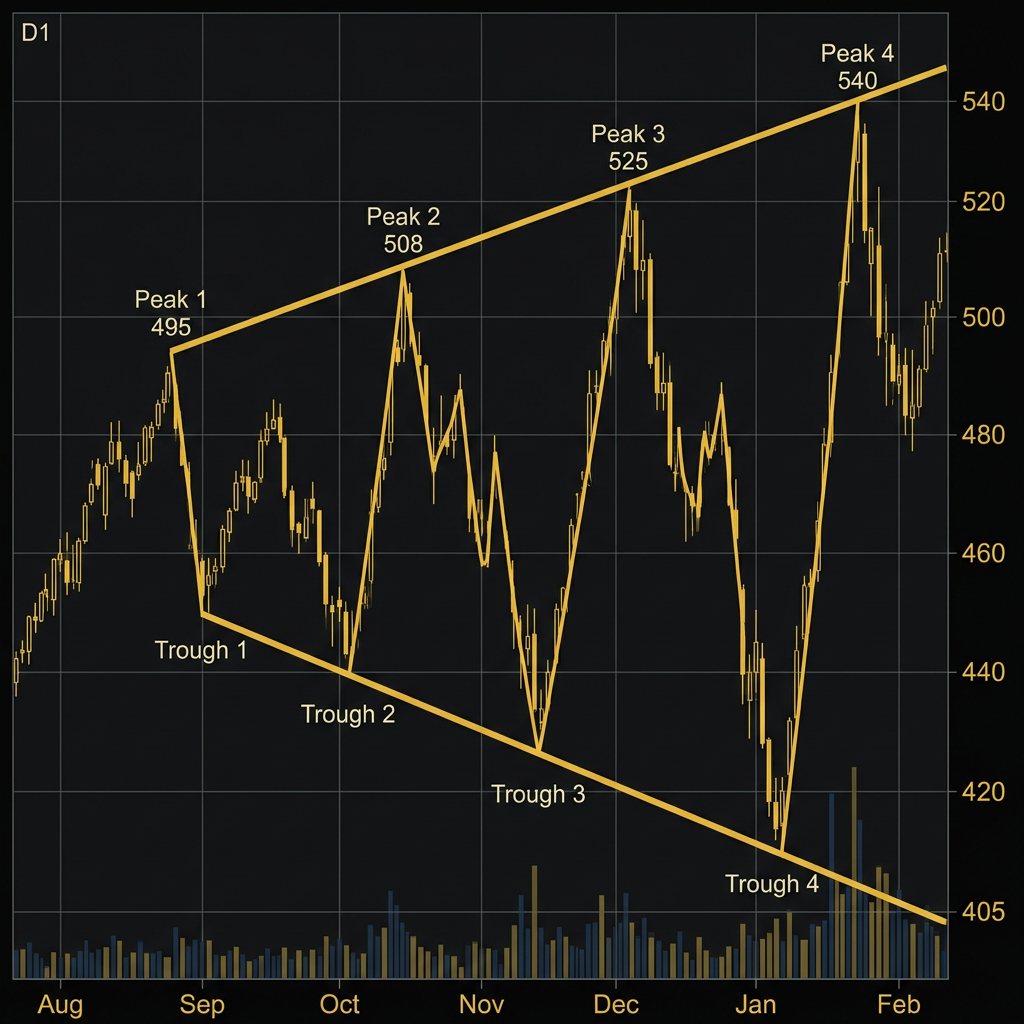
Broadening Pattern (Megaphone)
The opposite of a triangle — price makes higher highs AND lower lows, creating an expanding pattern that looks like a megaphone. Signals increasing volatility and market instability.
Broadening Pattern (Megaphone)
The opposite of a triangle — price makes higher highs AND lower lows, creating an expanding pattern that looks like a megaphone. Signals increasing volatility and market instability.
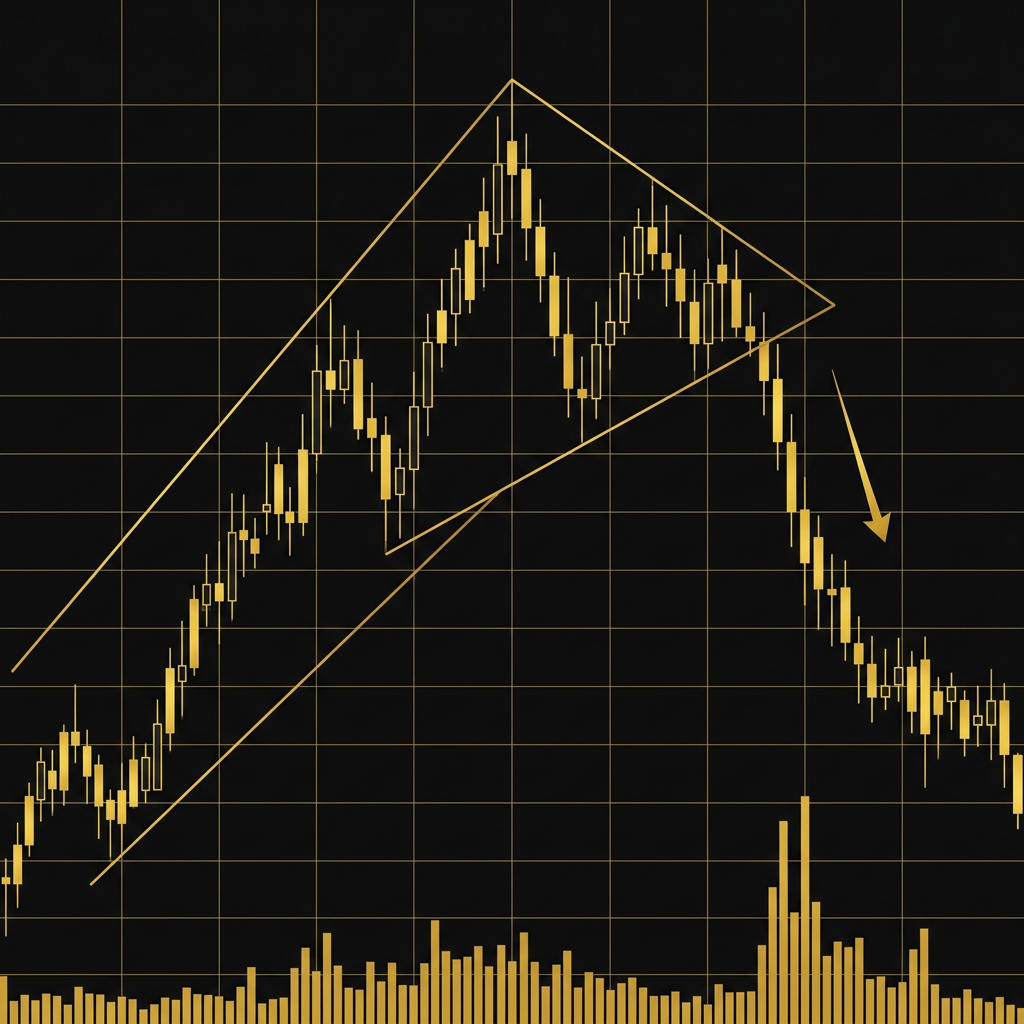
Diamond Top
A rare pattern that starts as a broadening formation and transitions into a symmetrical triangle, creating a diamond shape. Forms at market tops.
Diamond Top
A rare pattern that starts as a broadening formation and transitions into a symmetrical triangle, creating a diamond shape. Forms at market tops.
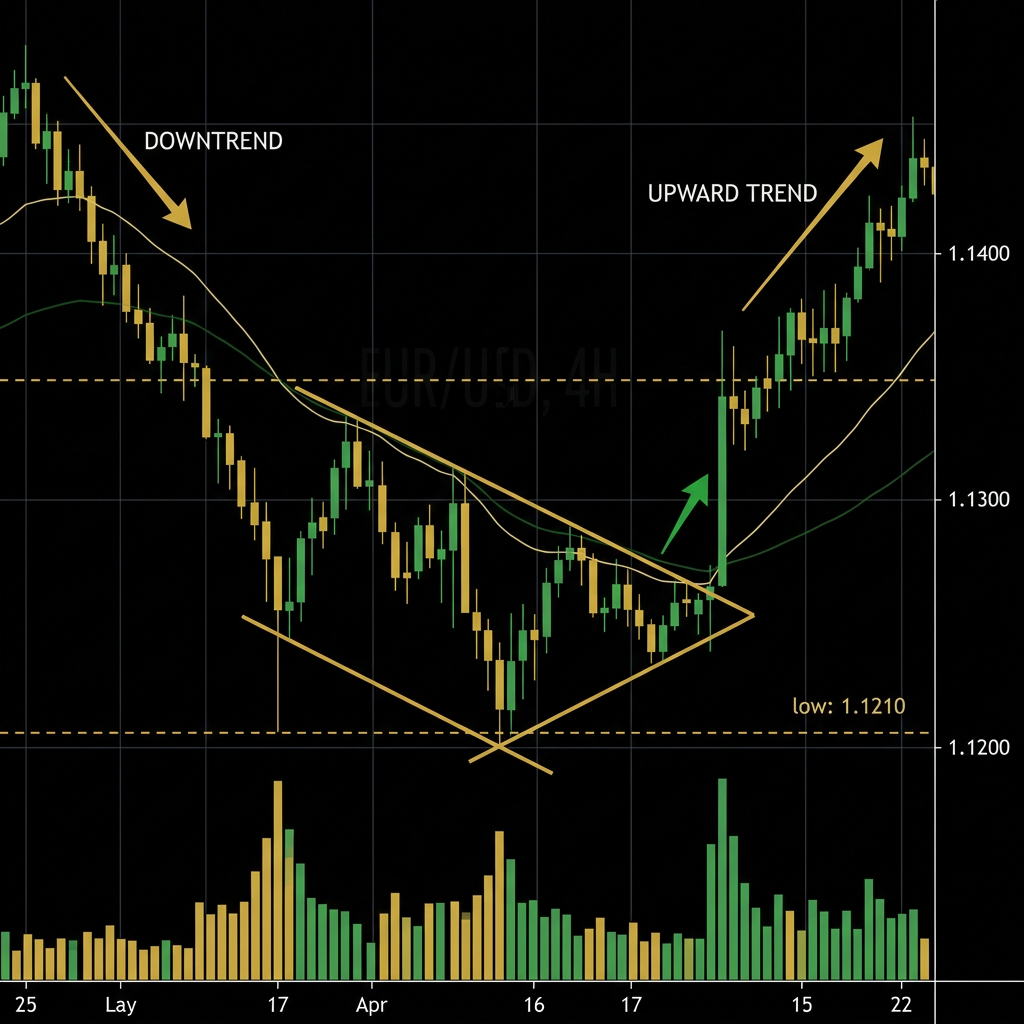
Diamond Bottom
The bullish version of the diamond top. A broadening formation transitioning to a narrowing one at market bottoms. Break above the upper boundary signals reversal.
Diamond Bottom
The bullish version of the diamond top. A broadening formation transitioning to a narrowing one at market bottoms. Break above the upper boundary signals reversal.

Rounded Bottom (Saucer)
A gradual, U-shaped reversal that forms over weeks to months. Price slowly transitions from a downtrend to an uptrend, creating a smooth curved bottom.
Rounded Bottom (Saucer)
A gradual, U-shaped reversal that forms over weeks to months. Price slowly transitions from a downtrend to an uptrend, creating a smooth curved bottom.
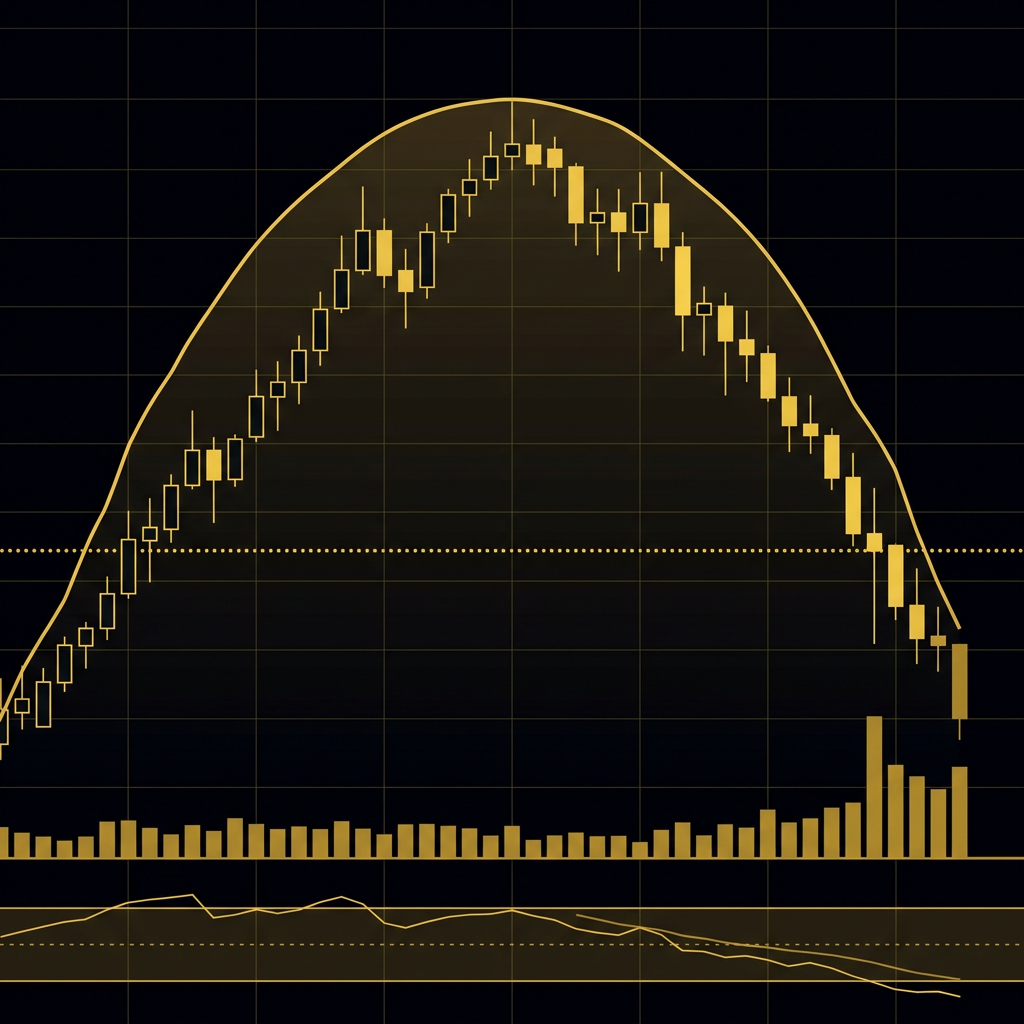
Rounded Top
An inverted U-shape reversal at market tops. Price gradually transitions from uptrend to downtrend over weeks to months.
Rounded Top
An inverted U-shape reversal at market tops. Price gradually transitions from uptrend to downtrend over weeks to months.